What does the "Custom Reports" functionality do?
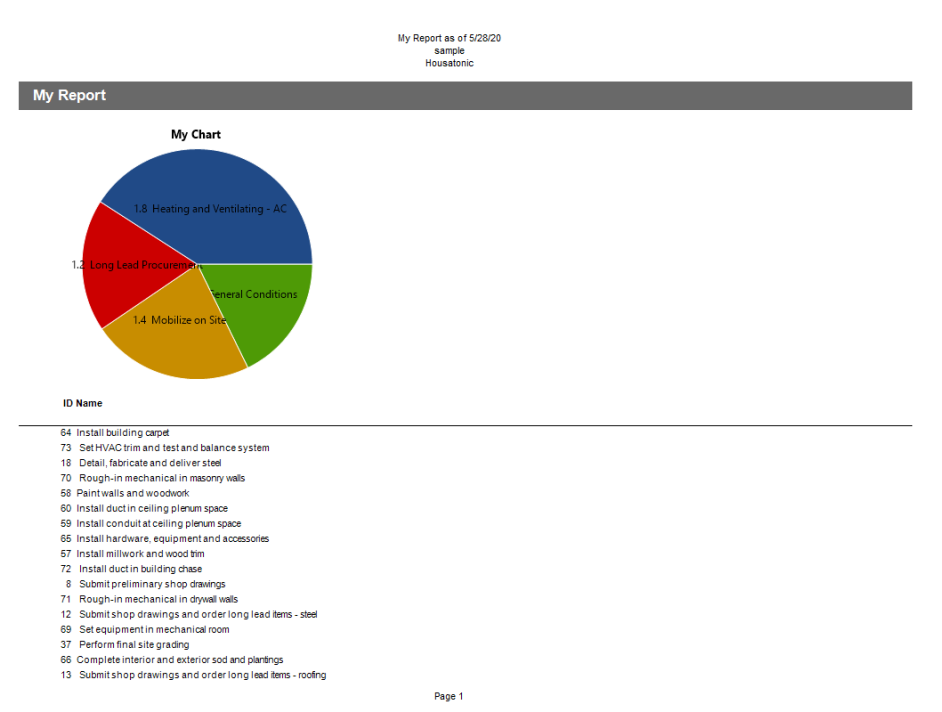
The "Custom Reports" functionality allows you to create and customize striking graphical reports of whatever project data you want.
How do I customize a report?
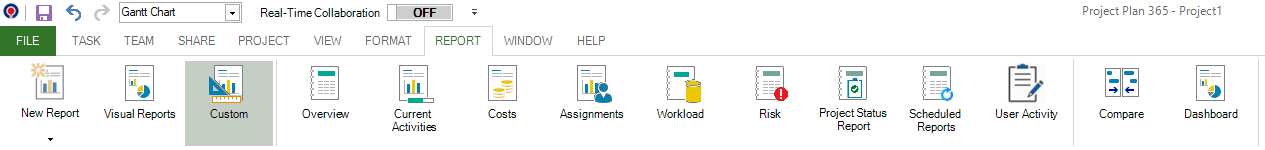
To change a custom report go to menu Project - Report - Custom. Select the desired report and click on the Customize button.
How do I create a custom report?
To create a new custom report go to menu Project - Report - Custom - New and fill in all the fields with desired settings.
What information is displayed on a custom report?
In a custom report, you can find information relating to resource and tasks. As you work on the project, the reports will reflect the latest info — no manual updates required!
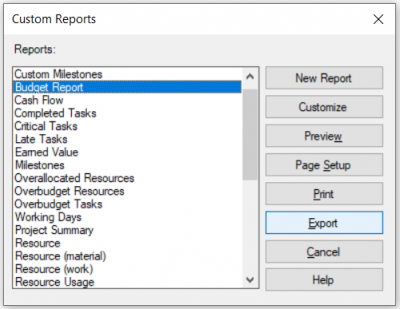
How can I export a report to CSV?
In order to export a report to CSV, go to the Report menu, select the report you want to be exported to CSV and click Export. In the Save as dialog, type the file name and choose the Save as type – Excel Export (*.csv) and then click Save.
How can I export a report to PDF?
To export a report to PDF, click the Report tab – Select the desires report – click Export – Select the location and the name for the report – Save.
Can I export the Cashflow report to csv/excel?
All the reports can be exported to CSV.
What information do the Cost Reports provide?
The Cost Reports provide information regarding the costs of the project such as Overbudget Tasks or Overbudget Resources.
How do I see a progress chart?
You can see a progress chart creating a custom report or a visual report by going to menu Report - Custom Reports - New.
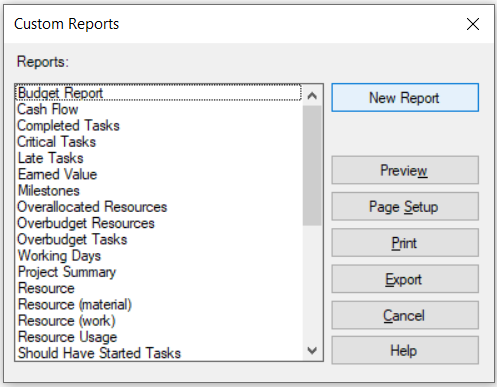
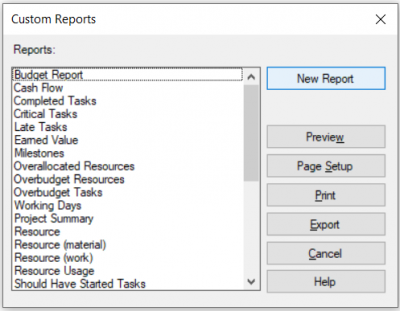
How can I view a list with all reports in Project Plan 365 app?
In order to view a list with all reports available in Project Plan 365 app, go to menu Report - Custom.
How can I customize the Cash Flow report?
We are sorry but the Cash Flow report can't be customized at this point.
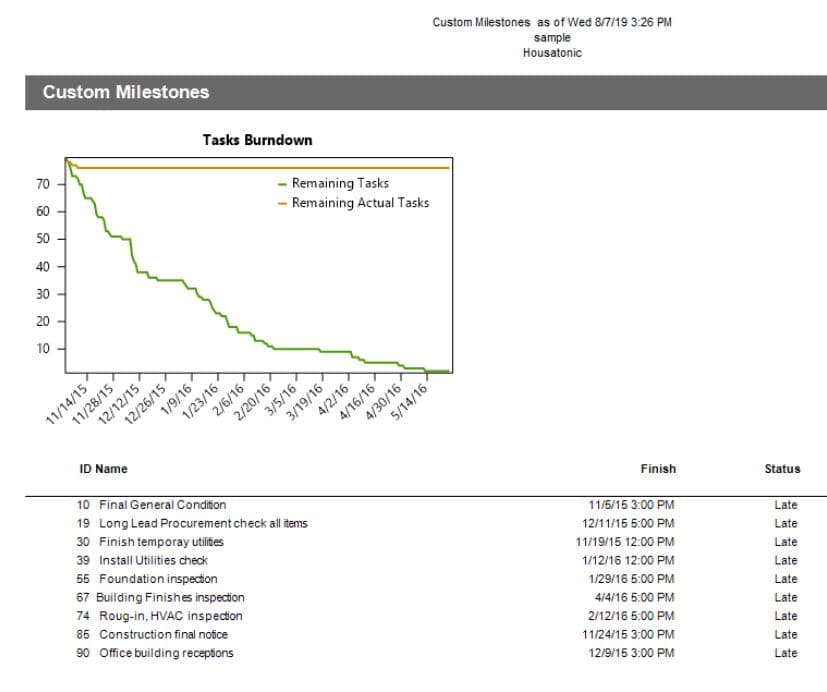
How can I see the delayed tasks in my project?
To see the delayed tasks in your project you can generate a report by going to menu Report – Overview-Late Tasks.
What does the “Help” button inside the “Custom Reports” dialog do?
The “Help” button inside the “Custom Reports” dialog redirects us to the “Custom Reports” article in our Online Help page.
What is Overview reports?
Overview reports display information regarding the entire Project duration.
What is Cost reports?
Cost reports provide information regarding the costs of the project.
What is Custom reports?
Custom reports are reports that provide information based on users settings.
What is Current activities reports?
Current Activities Reports displays information regarding task information such as: Unstarted tasks, Tasks in Progress or Completed Tasks.
What is Assignments reports?
Assignment Reports provides information regarding the project assignments such as Who Does What or the To-Do List.
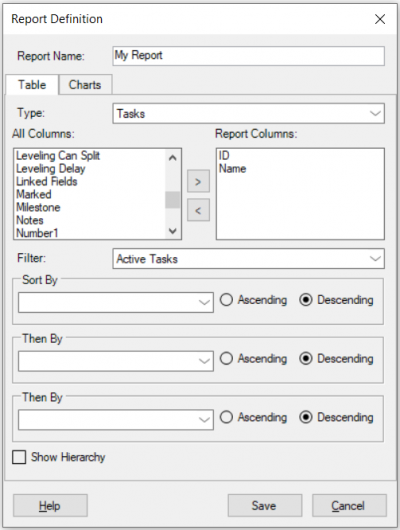
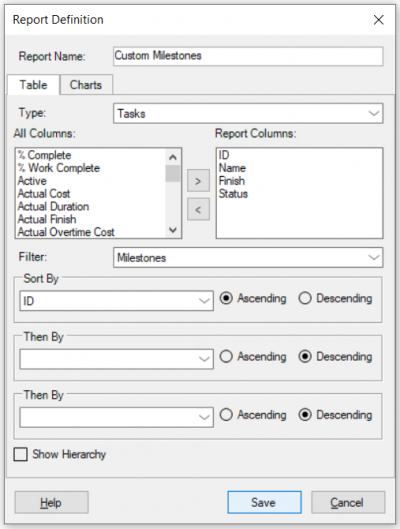
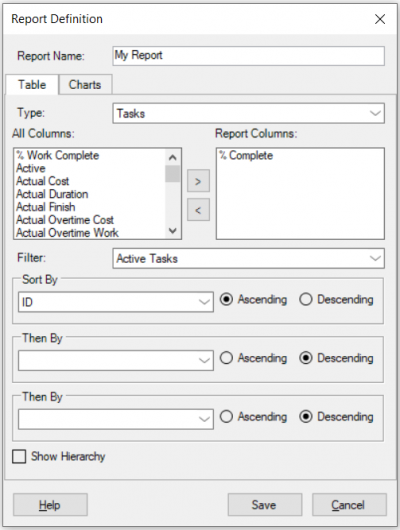
What does the "Show Hierarchy" checkbox inside the "Report Definition" dialog do?
The “Show Hierarchy” option in the "Report Definition" dialog allows you to display the summary tasks in the report.
For example, if you have 3 tasks (Task1, Task2, Task3) and Task 1 is a summary task and Task2 and Task 3 are subtasks, if the “Show Hierarchy” option isn’t checked, the Task1 won’t appear in the generated report. Once checked the “Show Hierarchy” option, Task1 will appear in the report.
How can I delete a custom report?
We are sorry but the "Delete Custom Report" option isn't available in our application at this point.
Why isn’t the Task Starting Soon report generating?
Please make sure you select the correct dates in the Date Range dialog for the report to be generated.
How can I create a report only with the columns I need?
To create a report only with the desired columns, go to menu Project – Report – Custom – New. From the “All Columns” section, select the desired fields and move them in the “Report Columns” section. Press “Save” for the changes to apply.
How can I customize the S-Curve report?
We are sorry but the S-Curve Report can’t be customized at this point.
Is there a way to move columns in the reports so you can fit all the data on one page?
We are sorry but at this moment we don’t support moving columns in the reports. As a workaround, you can change the Paper size for the desired Report. In order to do that, go to the Report menu, select the desired report from the list and click on the Page Setup button. After that, change the Orientation to Landscape and from the Paper Size, select a bigger one, for example A3.
Step by step how to create a custom report:
1. Open the desired project file.
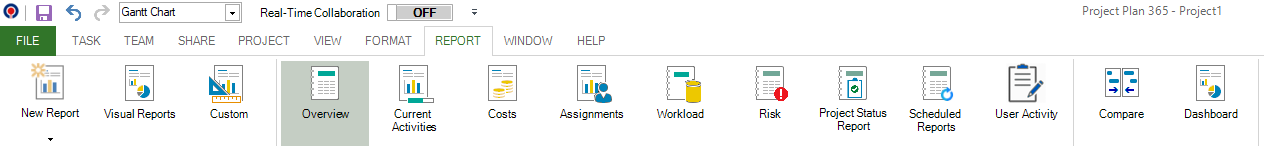
2. Go to menu Report - Custom.
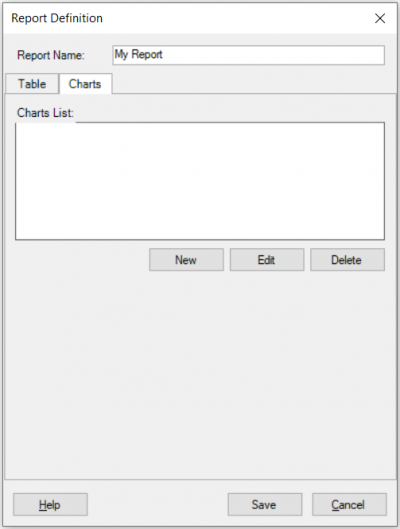
3. Click on the New Report button.
4. In the Table tab you can insert the report name, select columns, select filter and sort(optional).
5. In the Charts tab you can add/edit/ delete charts. Click on the New button to open the Charts Definition dialog.
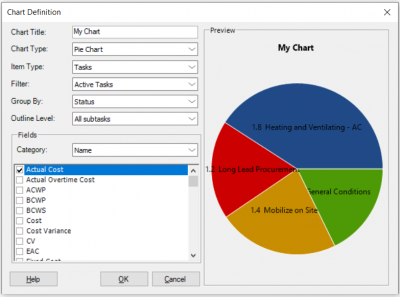
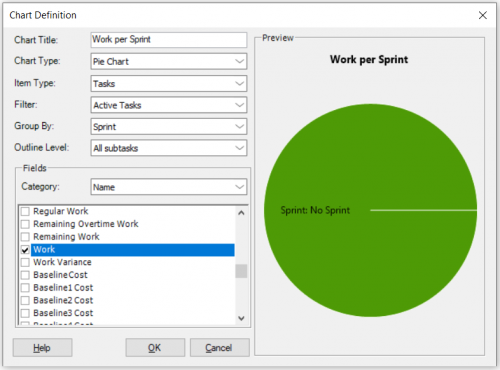
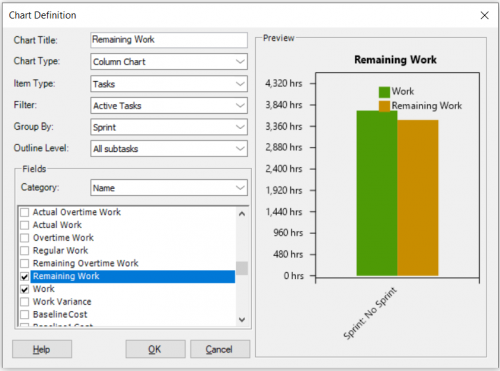
6. In the Chart Definition dialog you can:
- Insert the chart name
- Select chart type (Bar/Column/Line/Pie)
- Select item type(Task/Resource)
- Select filter
- Select group by
- Select outline level(task only)
- Select fields category(Name/Resource Names/ Time for tasks; Name for resources)
- Select what fields to be used for chart generation
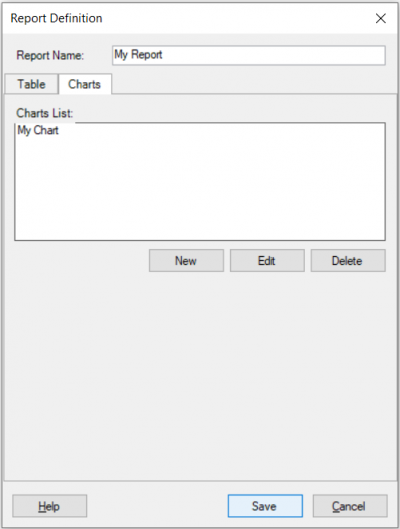
7. Click on the Save button to save the newly created report.
8. Click on the Preview button to visualize your report.
Step by step how to customize an existing report:
1. Open the desired project file.
2. Go to menu Report - Overview, for example.
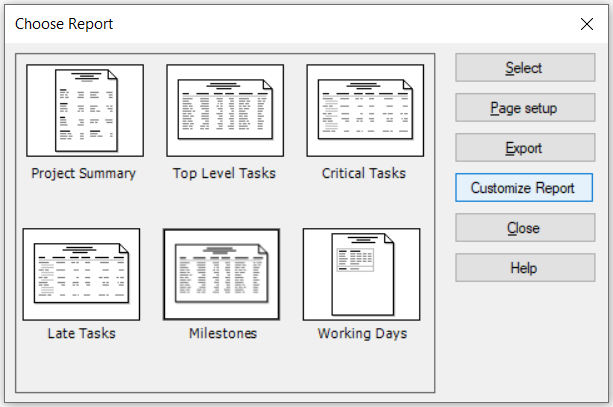
4. Select the Milestones report, then press on the Customize Report button.
5. Select the desired changes and click on Save.
6. The customized report will be opened.
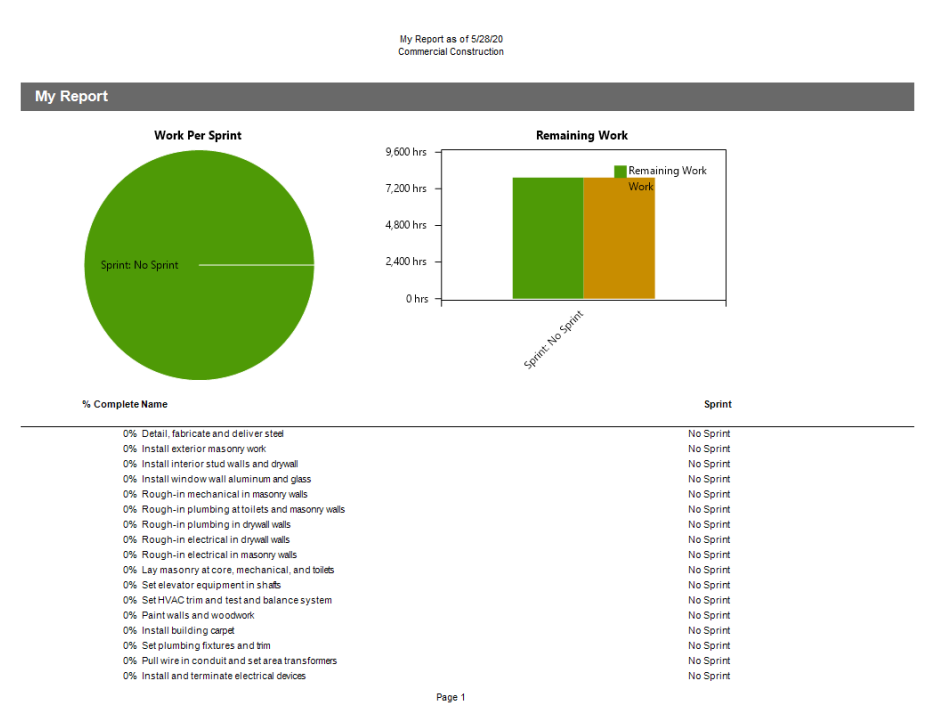
Use Case Sprints:
We have an agile project and we want to create a report that reflect the amount of work for each sprint and the remaining work.
Steps to achieve this:
1. Open the desired project.
2. Go to menu Report - Custom - New Report.
3. Fill in the report’s name, select the desired fields to be shown in the table and sort by Task Id ascending.
4. Go to Charts tab and create two new charts as following:
- Work per Sprint:
- Type - Pie Chart
- Filter - Active Tasks
- Group by Sprint
- Fields category - Name(Task Name)
- Select work field
- Preview and press OK to save the new chart
- Remaining Work:
- Type – Column Chart
- Filter – Active Tasks;
- Group By – Sprints;
- Fields Category -Name(Task Name);
- Select Remaining Work and Work fields;
- Preview and press OK to save the new chart.
5. Press Save in Customize Report dialog.
6. Press Preview or double-click the newly created report to see the results.
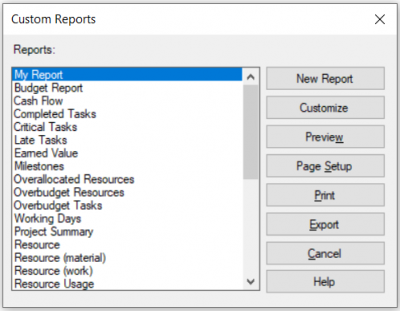
Step by step on how to view a list with all available reports in Project Plan 365 app:
1. Go to menu Report - Custom.
2. Select the desired Report and click on Preview, Print or Export button.