
What does the “Gantt Chart Actions” functionality do?
“Gantt Chart Actions” describes what actions can be performed in the right-side portion of the Gantt Chart or Tracking Gantt View.
What actions can I perform directly on the Gantt Chart?
On the Gantt Chart you can create dependencies, change relationships between tasks, drag a taskbar to change start and finish dates of tasks, resize taskbars to change duration of tasks, add progress to tasks, or change the appearance of nonworking time.
How do I add relationships between tasks directly on the Gantt Chart?
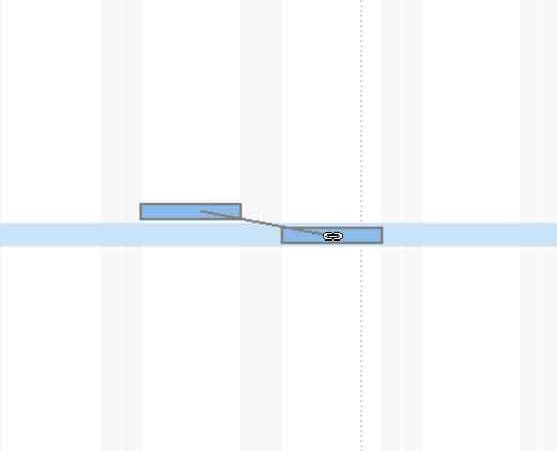
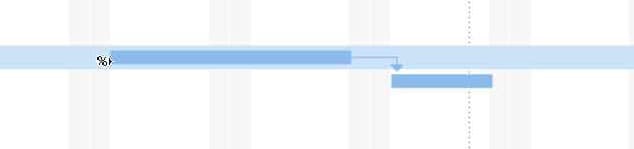
In the Gantt Chart, you can create dependencies by clicking on the Gantt bar of a task and dragging to another Gantt bar to create a Finish-to-Start dependency between the two tasks.
How do I change the relationship between tasks from the Gantt Chart?
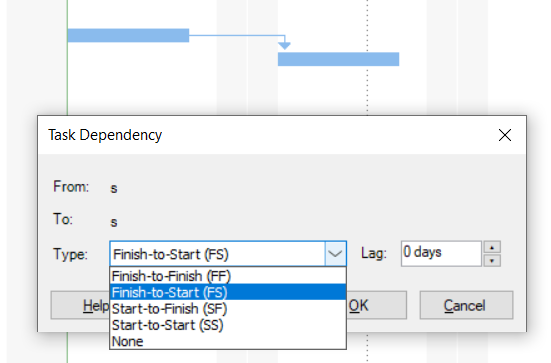
To change the relationship between tasks from the Gantt Chart, apply the Gantt Chart View, double click on a link from the right-side chart portion of the view. In the Task Dependency dialog select the desired relationship and click OK.
How do I change the start and finish dates of a task by dragging the taskbar?
To change the start and finish dates of a task directly from the Gantt Chart, locate in the chart area the task bar corresponding to the task that you want to adjust its start and finish date and drag the task bar to the left or right as you want. During the dragging process, a virtual taskbar will be shown, guiding you through the change step.
How do I change the duration of a task by resizing it?
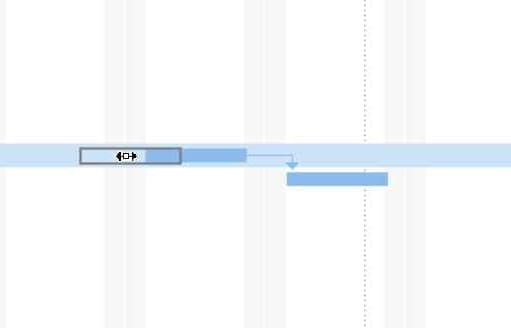
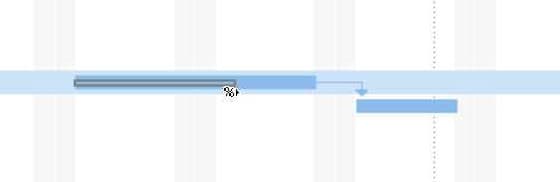
To change the duration of a task by resizing it, move your mouse at the end portion of the bar and you should notice a specific icon of the mouse. Hold down the mouse and move the virtually displayed taskbar to the right if you want to increase the duration of the task, or to the left if you want to shorten the duration of your task. Release the mouse when you are satisfied to the resulted duration of your task or length of its corresponding taskbar.
How do I add progress to a task directly from the Gantt Chart?
To add progress to a task in your project directly from the Gantt Chart, follow the steps below:
- Locate in the right side chart of a Gantt view its corresponding taskbar.
- Place the mouse to the start portion of the taskbar, when you will notice that the mouse indicator changes to a specific icon.
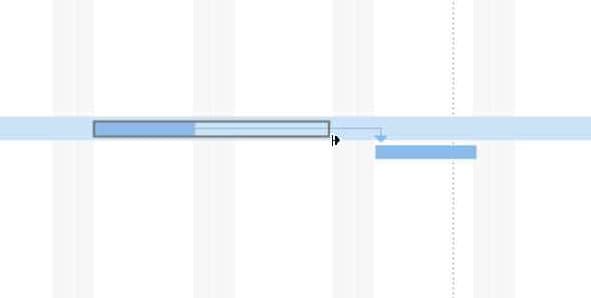
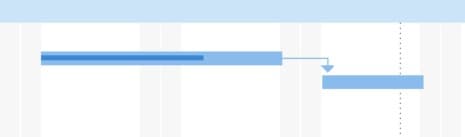
- To indicate progress for a task, hold down the mouse and drag to the right the gray displayed bar inside the task bar to increase the value for the % complete field.
- Release the mouse when you are satisfied with the entered progress.
- The % complete corresponding to the task is represented by a darker and thinner bar inside the bar of the task.
Can I remove nonworking time from my Gantt Chart?
Although you can format nonworking time, you cannot remove it from the timescale in a view.
How do I format the nonworking time from the Gantt Chart?
To format the nonworking time from the Gantt Chart, go to the Gantt Chart View – on the Format menu – click Timescale – select the Non-working time tab –apply the needed settings and click OK.
What does the “Help” button inside the Task Dependency dialog do?
The “Help” button inside the Task Dependency dialog redirects you to the “Link Unlink Tasks” article in our Online Help page.
Step by step on how to add relationships between tasks:
1. Apply Gantt Chart view.
2. Click on the Gantt bar of a task and drag it to another Gantt bar to create a Finish-to-Start dependency between the two tasks. Notice the specific icon of the mouse that indicates the linking process.
Step by step on how to change the relationship between tasks:
1. Apply Gantt Chart view.
2. Double-click on a link from the right side-chart portion of the view. Be sure to place your cursor directly on the dependency line.
3. In the opened Task Dependency dialog indicate the type of relationship you want between the two tasks. You can also indicate the amount of lag associated to this dependency.
4. After you click the OK button in this dialog, you will notice that the change is immediately reflected in the Predecessors column in the left side grid, but also visually in the right-side chart portion of the view.
Note: By using the Task Dependency dialog you can also quickly delete a relationship between any two tasks.
Step by step on how to change the start and finish dates of a task:
1. Apply Gantt Chart view.
2. Locate in the chart area the taskbar corresponding to the task that you want to adjust its start and finish date.
3. Drag the taskbar to the left (the task will start earlier) or right (the task will start later). During the dragging process, a virtual taskbar will be shown, guiding you through the change step. Change is immediately reflected in the Start and Finish columns in the left side grid.
Step by step on how to change duration of a task:
1. Apply Gantt Chart view.
2. Move your mouse over the end portion of the bar and you should notice the specific icon of the mouse that appears.
3. Hold down the mouse and move the virtually displayed taskbar to the right if you want to increase the duration of the task, or to the left if you want to shorten the duration of your task.
4. Release the mouse when you are satisfied to the resulted duration of your task or length of its corresponding taskbar. Change is immediately reflected in the Duration column in the left side grid.
Step by step on how to add progress to a task:
1. Apply Gantt Chart view.
2. Locate in the chart area the taskbar corresponding to the task you want to add progress to.
3. Place the mouse to the start portion of the taskbar. You will notice that the mouse indicator changes to a specific icon.
4. Hold down the mouse and drag to the right the gray displayed bar inside the taskbar to increase the value for the % complete field.
5. Release the mouse when you are satisfied with the entered progress. The % Complete corresponding to the task is represented by a darker and thinner bar inside the bar of the task. Change is immediately reflected in the % Complete column in the left side grid.
Step by step on how to change the Links, Date Format and Height of Gantt bars:
1. Apply Gantt Chart view.
2. Right-click on any portion inside the right-side chart and from the displayed contextual menu choose Layout option.

3. In the Layout dialog box, under Links, choose the type of link line that you want to use. If you choose the first type of link, then the link lines will not appear.
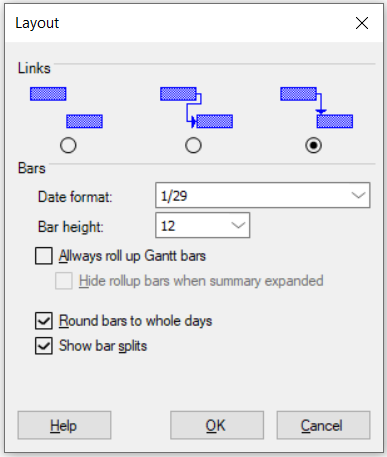
4. In the Bar height box, select the height for the bar you want.
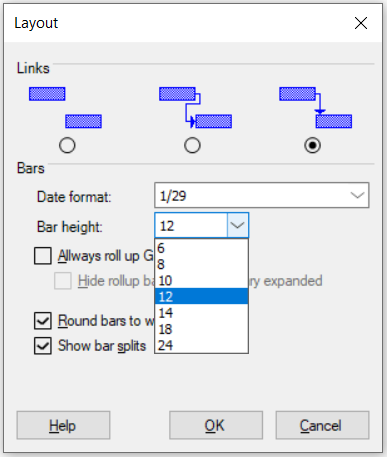
5. In the Date format box, select a date format.
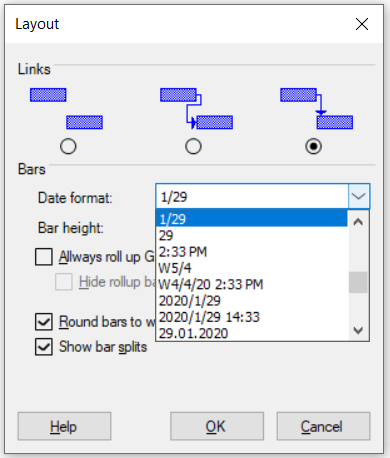
6. Click OK.
Step by step on how to change the appearance of non-working time:
1. Apply Gantt Chart view.
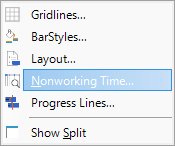
2. Go to Format menu – Timescale or right-click on any portion inside the right-side chart and from the displayed contextual menu choose Non-working Time option.
3. Click the Non-working time tab, and then select a Color and a Pattern to represent non-working time in the Gantt view.
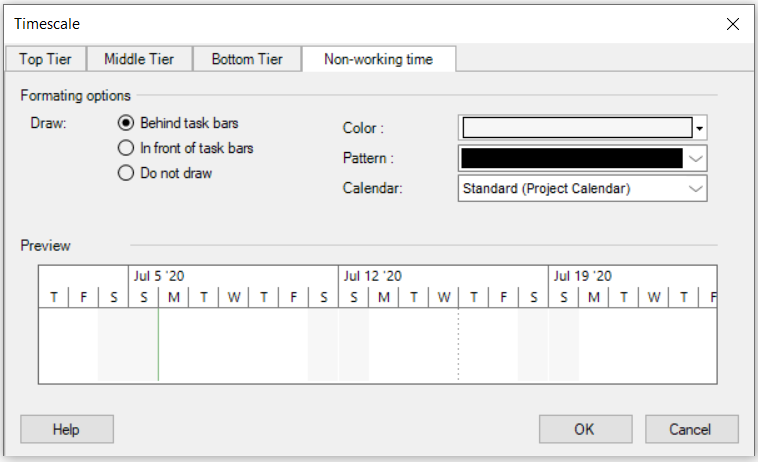
4. If you want to change the appearance of the Gantt view to display non-working time for a resource (such as vacation times, as well as weekends), in the Calendar list, select the calendar for the resource.
5. See the changes in the Preview box and then click OK to save them.
Note: Although you can format non-working time, you cannot remove it from the timescale in a view.