S-Curve Report
Online Help > S-Curve Report
What does the “S-Curve” report do?
S-Curve report helps you quantify the performance of a project. It compares costs and schedules to a baseline to determine if the project is on track.
This is a powerful tracking and budgeting feature in Project and helps you answer questions like, “Looking at the amount of work done so far in this project, how much money were we supposed to have spent?” Which then leads to other questions like, "Will we finish on time?"
If the charts don't look right, make sure you have set a baseline, assigned costs to tasks or resources, and entered progress.
How do I export the S-Curve report?
To Export the S-Curve report, go to Report – Visual Reports – select the S-Curve report – click Export – select the exporting format (Excel, Word, XML, PDF or image) and the location where you want to save it and click Save.
What charts are available in the S-Curve report?
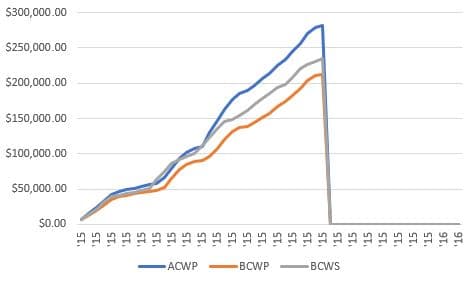
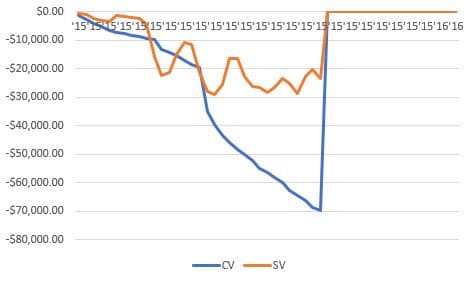
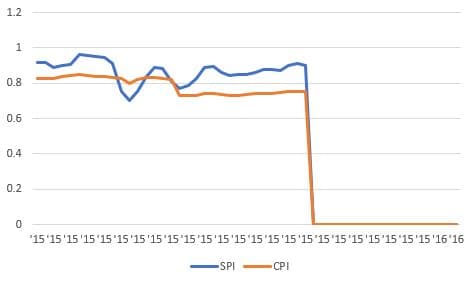
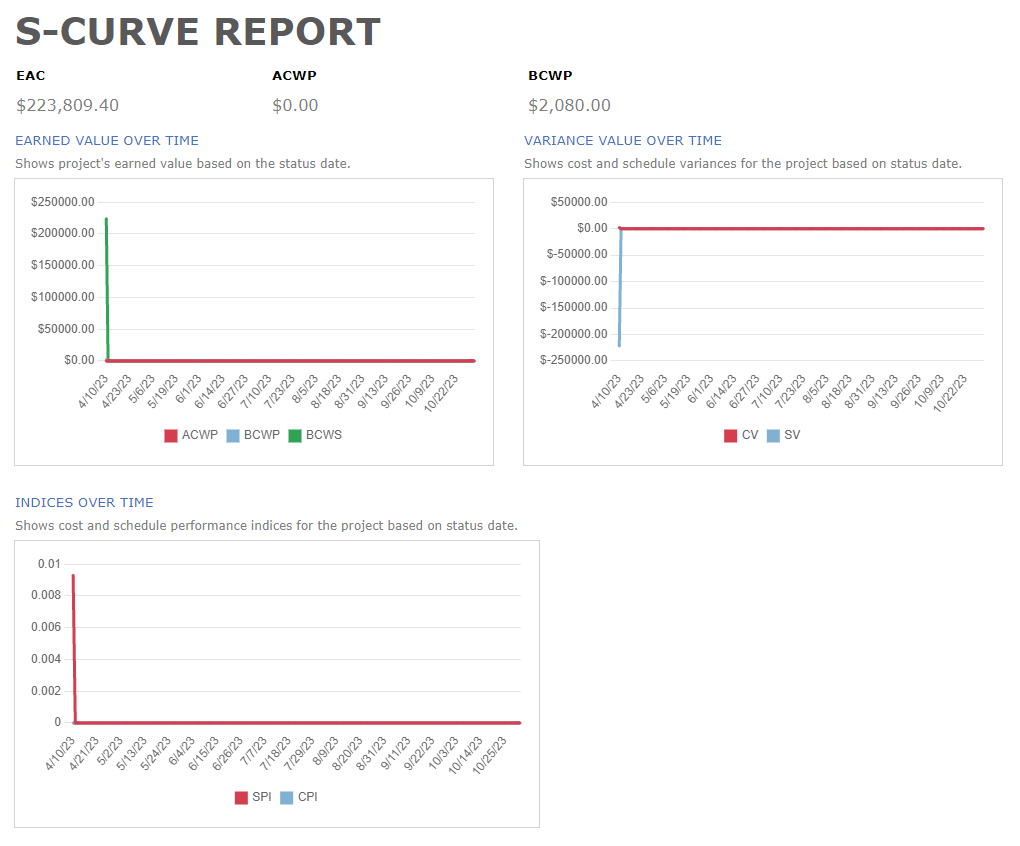
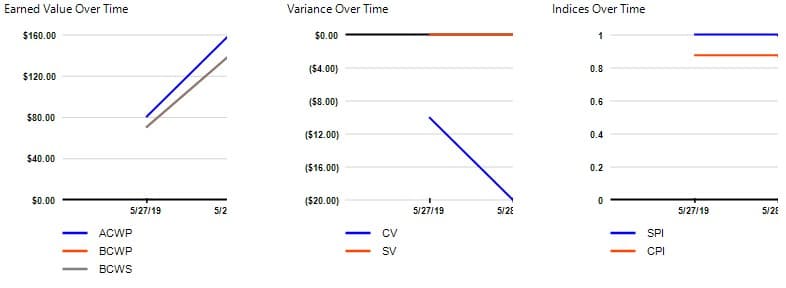
In S-Curve report are available three charts: Earned Value Over Time, Variance Over Time, Indices Over Time.
How do I input the actual cost for generating the S-Curve report?
The Actual cost depends on the cost and % complete you set on your tasks. Please insert the resource cost and assign the resources to tasks and set the %complete for each task. Then you can generate the S-curve report by going to menu Report - Visual Reports - S-Curve Report.
What does the Earned Value Over Time chart show in S-Curve report?
The Earned Value Over Time chart shows project’s earned value based on the status date. If actual cost (ACWP) is higher than earned value (BCWP), then the project is over budget. If planned value (BCWS) is higher than earned value, then the project is behind schedule.
What does the Variance Over Time chart show in S-Curve report?
The Variance Over Time chart shows cost and schedule variances for the project based on status date. If CV is negative then the project is over budget. If SV is positive, then the project is behind schedule.
What does the Indices Over Time chart show in S-Curve report?
The Indices Over Time chart shows cost and schedule performance indices for the project based on status date. The greater the performance index, the more on schedule and cost saving the project.
How do I generate the S-Curve report?
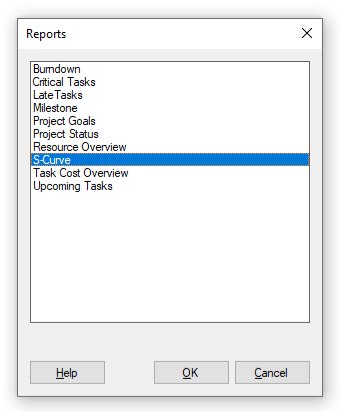
In order to generate the S-Curve report, go to menu Report - Visual Reports - S-Curve report.
What does the “Help” button inside the “Choose Report” dialog do?
The “Help” button inside the “Choose Report” dialog redirects us to the “Custom Reports” article in our Online Help page.
What is ACWP and how it is calculated?
ACWP represents the cost incurred for work performed until status date (or today date if status date not set). By default, how and when ACWP is calculated depends on the assigned resources’ Standard Rate, Overtime Rate, Per Use Cost, and Cost accrual settings in the Resource Information dialog box, as well as the actual work reported, fixed costs for tasks, and the status date or today’s date. Project Plan 365 can calculate ACWP even if you do not have resources assigned. In this case, the calculations are based on progress (percentage of completion or actual work) and fixed costs to date for the task.
How do I get to use the Visual Reports?
In order to have access to "Visual Reports" you need an active Business Subscription.
In order to Upgrade to Business trial, please Sign In with your email and password in our Portal page and in Account menu click on “Upgrade to Business Trial” button.
What are the differences between the Planned Value and the Earned Value?
The Planned Value represents the budgeted cost of work scheduled while the Earned Value is the budgeted cost of work performed.
Step by step on how to generate the S-Curve report:
1. Go to menu Report - Visual Reports.
2. Click on S-Curve Report and press on OK button.
3. The S-Curve Report will be generated.
Fields
ACWP – Actual - Actual Cost of Work Performed contains the costs incurred for work, up to up to the project status date or today’s date.
BCWS – Planned - Budgeted Cost of Work Scheduled contains the cumulative baseline costs up to the status date or today’s date.
BCWP - Earned – Budgeted Cost of Work Performed contains the cumulative value of the percent complete multiplied by the baseline costs up to the status date or today’s date.
SV - The SV (earned value schedule variance) field shows the difference in cost terms between the current progress and the baseline plan.
CV - The CV (earned value cost variance) fields show the difference between how much it should have cost and how much it has actually cost to achieve the current level of completion up to the status date or today's date.
SPI - The SPI (schedule performance index) field shows the ratio of the budgeted cost of work performed to the budgeted cost of work scheduled (BCWP/BCWS).
CPI - The CPI (cost performance index) fields show the ratio of budgeted (or baseline) costs of work performed to actual costs of work performed, up to the project status date or today's date.
Example of how to use the S-Curve Report:
Initial
The baseline duration for a task (Main building) is 8 days, and its baseline cost is $400 (Team 1 is assigned to it at 100%).
The baseline duration for another task (Landscaping) is 3 days, and its baseline cost is $60. (Team 2 is assigned at 100%).
Budget
After 2 days, first task is in plan (25%), and second task is at 67% but in order to do that Team 2 had to work at 150%.
The result is:
Over budget - BCWP (budgeted cost of work performed) is higher than ACWP (actual cost of work performed)
This can be observed on all 3 charts as:
You can compare the BCWP to the ACWP (actual cost of work performed) field to determine whether the task is on track in terms of budget.
The CV field shows the difference between these fields.
CPI is the ratio of BCWP (budgeted cost of work performed) to ACWP (actual cost of work performed)
Schedule
After another 2 days, first task is only at 40%, and second tasks is finished as planned.
The result is:
Over schedule – BCWP (budgeted cost of work performed) is lower than BCWS (budgeted cost of work scheduled)
This can be observed on all 3 charts as:
You can compare the BCWS to the BCWP (budgeted cost of work performed) field to determine whether the task is behind or ahead of schedule in terms of cost.
The SV (earned value schedule variance) field shows the comparison of these fields over time.
The SPI (schedule performance index) field shows the ratio of the budgeted cost of work performed to the budgeted cost of work scheduled (BCWP/BCWS).
Final
At the end of the project, all tasks are completed in time as Team 1 manages to recover the delays.
The results are:
Scheduling was on time – BCWS and BCWP are at the same level.
Still overbudget from the first 2 days – ACWP over BCWP.
| Related | More Reports | Dashboard | Compare | Burndown Report | |
| Platform | Windows | Mac | iOS | Web | Android |
| ✔ | ✔ | ✔ | ✔ | ||
| Product | Project Plan 365 | ||||
| Article ID | 336 | ||||
| Date | 4/10/2023 |


