
A dashboard aggregates multiple project files (either located on the user machine or online) in a virtual master project to help the user get a higher-level perspective on his projects. It offers the advantage of bringing projects together in order to analyze them, without having to manually insert them as subprojects into a master file expressly created for this purpose. The feature is especially useful to observe resources - it is actually a frequent scenario that in overlapping projects considered individually resources are not overallocated, but when considered as a whole, shared resources across multiple projects are assigned to more work than the normal working capacity.
 Practice
Use 3 project files:
1. CommercialConstruction project plan - on the local hard drive (this is the project created during previous lab)
2. Residential Construction.mpp - on the local hard drive. It should look like ![]() Residential-Construction.mpp.
Residential-Construction.mpp.
3. PaintHome.mpp - on the local hard drive. It should look like ![]() PaintHome.mpp .
PaintHome.mpp .
First you need to access the Dashboard report from the Report menu bar :
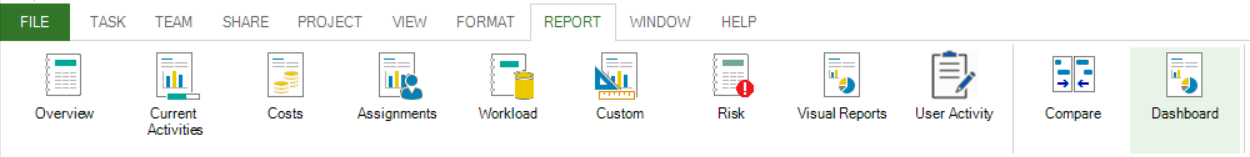
When clicking on this option, a New Dashboard dialog will be displayed:
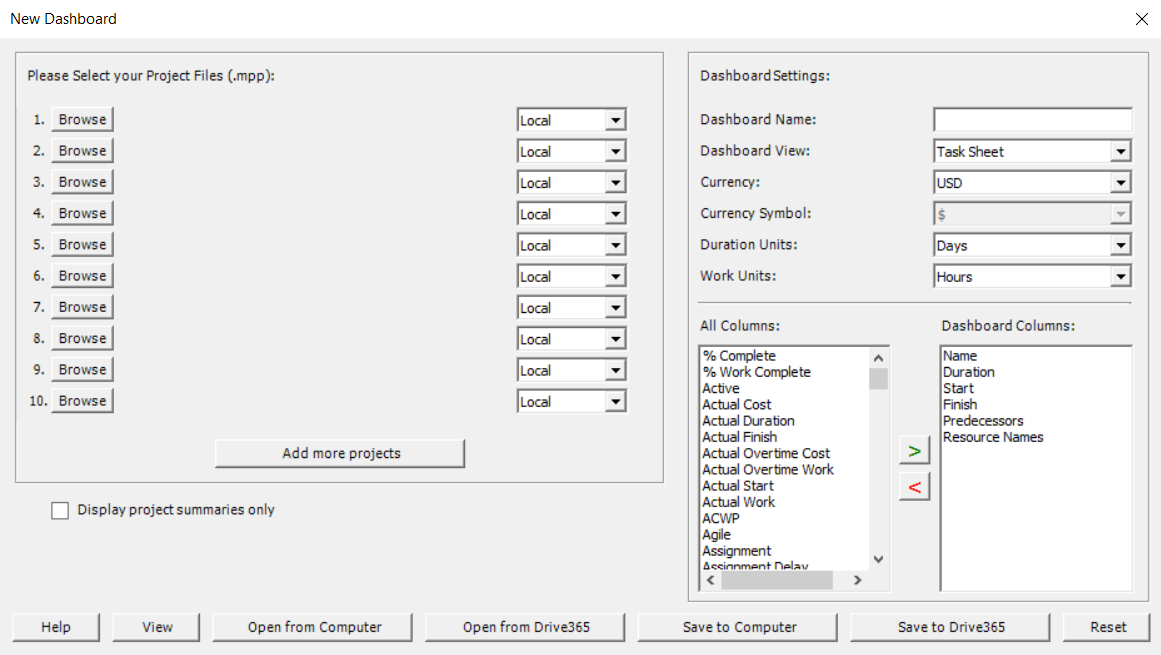
On the left side of the dialog, projects need to be selected.
After the files have been selected, the user needs to configure the Dashboard settings, according to the projects' settings and the viewing preferences. The default Dashboard view is Task Sheet and it is also the only one that allows choosing the columns to be displayed on rendering.
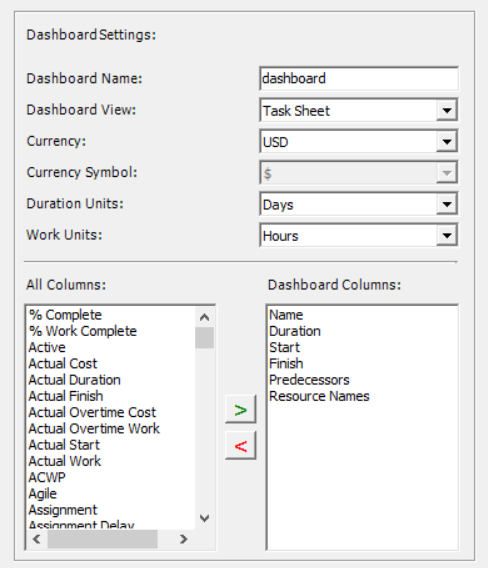
The default columns are those of the Entry table:
1. Name
2. Duration
3. Start
4. Finish
5. Predecessors
6. Resource Names
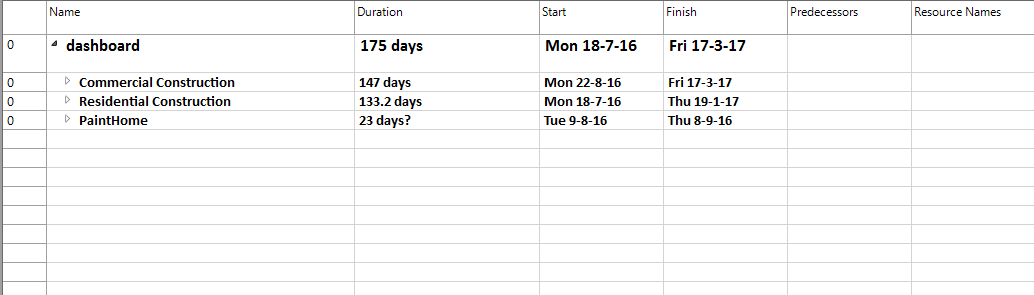
To add to this list, the user needs to select a column from the left list and press the " > " button. To exclude a column, the user needs to select it from the right list and then press the "< " button. If the user is happy with the selected options, he needs to simply click Enter or press the View button. After pressing View button it will get:
Exporting a dashboard project with Project Plan 365
If the user wants to see his dashboard with the Project Plan 365 application, he needs to export it as a project. In order to accomplish this, he needs to enter the File menu - Import/Export - Export and choose Export Dashboard.
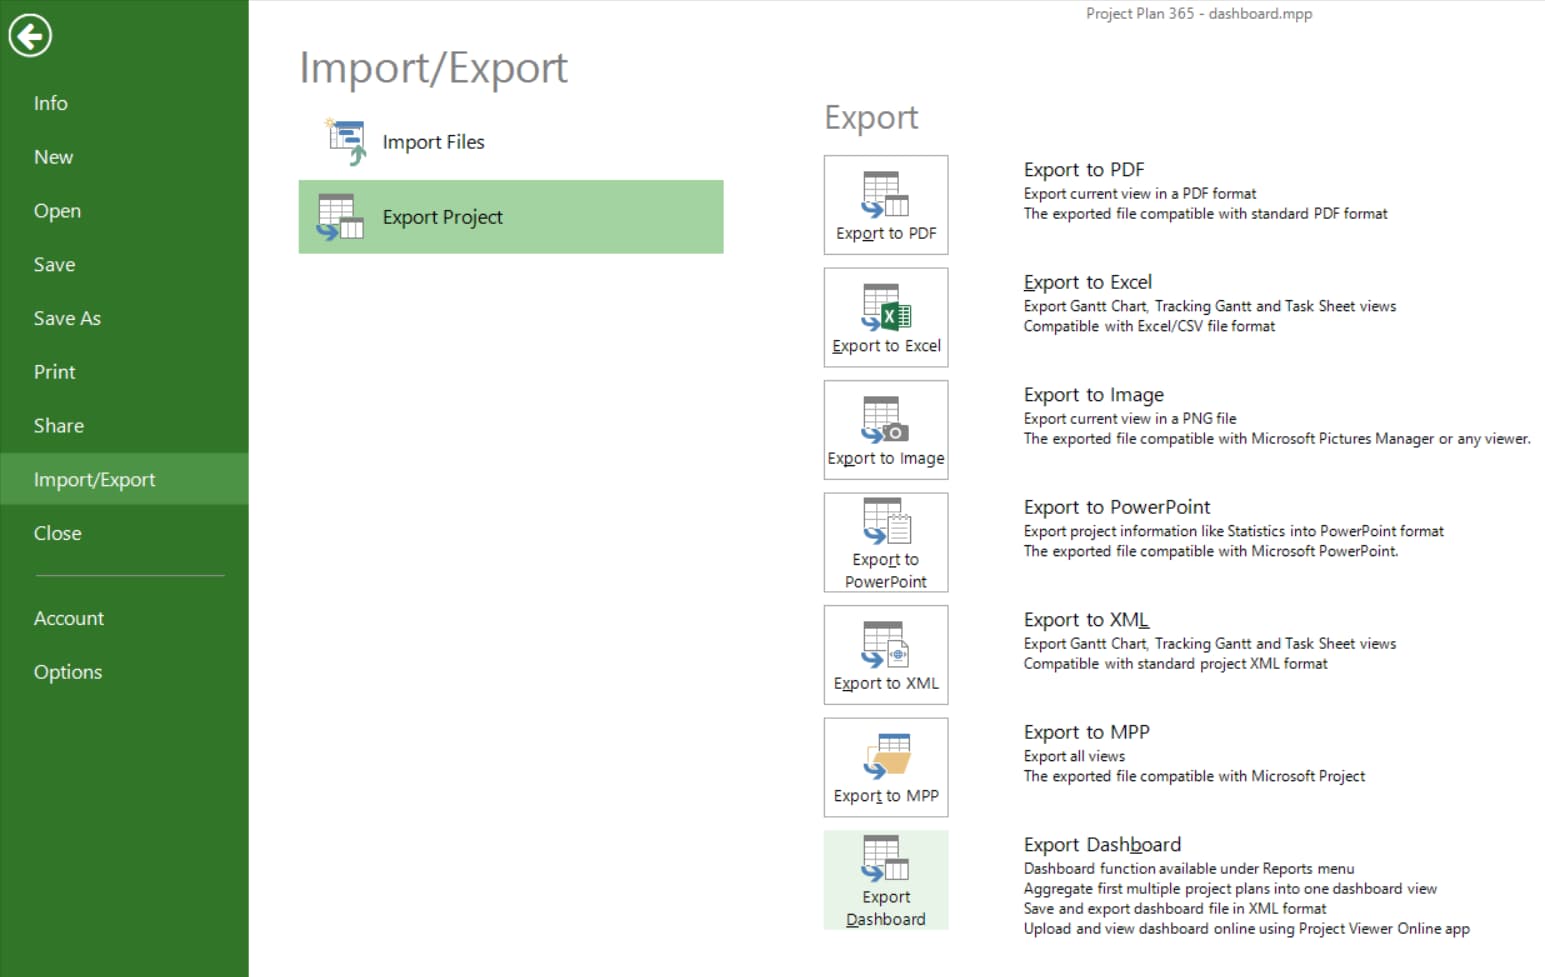
A dashboard project suitable for the Project Plan 365 application is a regular XML project file which contains additionally some dashboard preferences regarding the default view and the columns that will be displayed. The dashboard export is done in a what-you-see-is-what-you-get manner, meaning that the view and columns shown at the moment of the export will be those displayed when importing the dashboard project.
Opening a Dashboard project in Project Plan 365
Open Project Plan 365 application and select the XML file from your local disk that was previously obtained after exporting the dashboard. Take into account that in the Open dialog in the left side corner to select All Files as type of files to be displayed in the Open dialog, so you can select your XML file. Simply browse for your dashboard project (dashboard_project.xml from the section above) and click Open.
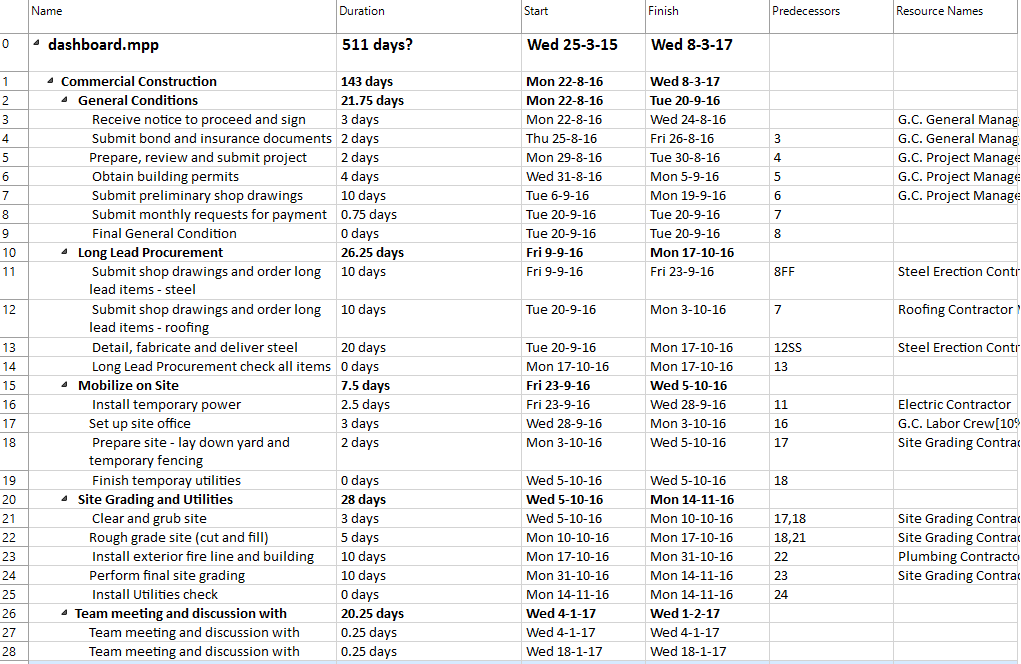
And here is the Dashboard project, with the viewing preferences (view and columns) at the moment of exporting it.
Note: Click Help button to find more about Dashboard functionality.