What does the “Burndown” report do?
The "Burndown" report is a visual representation of work left to do versus time. It gives you the project status by comparing the planned, completed and remaining work on a chart, based on your current project data.
What charts are available in the Burndown report?
In Burndown report are available two charts: Work Burndown and Task Burndown.
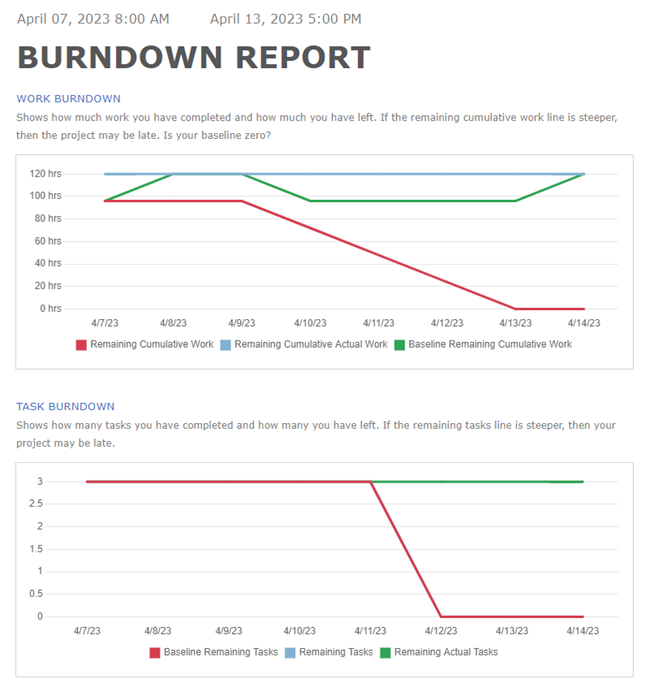
What does the Work Burndown chart show in the Burndown report?
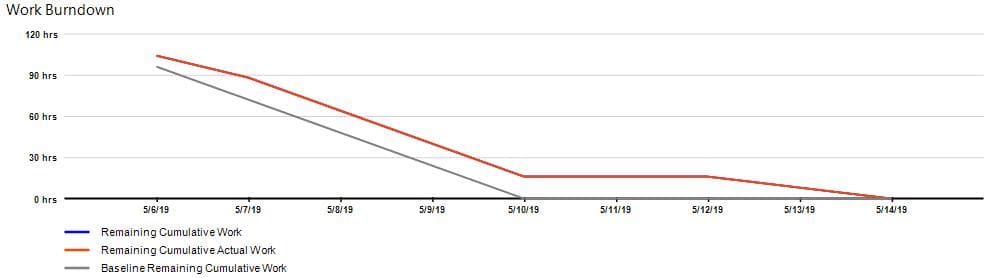
The Work Burndown chart shows a comparison of how much work is finished, how much work is scheduled to be finished and the baseline estimate of how much work would be completed at this point in the project.
What does the Task Burndown chart show in the Burndown report?
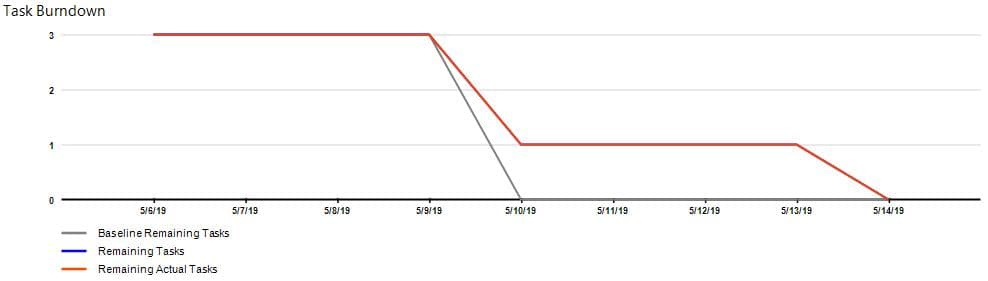
The Task Burndown chart shows a comparison of the number of tasks finished, the number of remaining tasks and the baseline estimate of how many tasks would be finished at this point in the project.
How do I generate a burndown report with Project Plan 365?
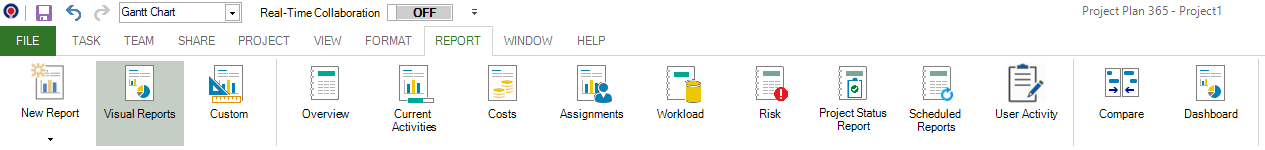
To generate the Burndown report, go to menu Report - Visual Reports - Burndown Report.
Note: To access the original version of the Burndown Report, please go to menu Report – Custom – select Burndown Report – click Preview.
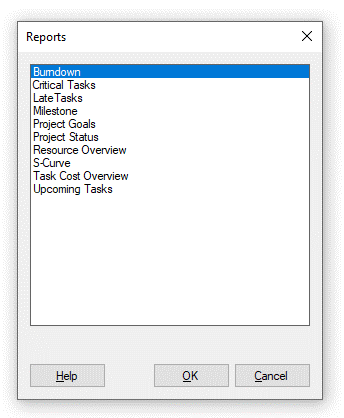
What does the “Help” button inside the “Choose Report” dialog do?
The “Help” button inside the “Choose Report” dialog redirects us to the “Custom Report” article in our Online Help page.
How do I get to use the Visual Reports?
In order to have access to "Visual Reports" you need an active Business Subscription.
In order to Upgrade to Business trial, please Sign In with your email and password in our Portal page and in Account menu click on “Upgrade to Business Trial” button.
Step by step on how to generate the Burndown report:
1. Go to menu Report - Visual Reports.
2. Select the “Burndown Report” and click on the OK button.
Fields
Remaining Cumulative Work - Contains the remaining amount of time scheduled for all resources assigned to a task, accumulated over time.
Formula: Remaining Cumulative Work = Total Work – Cumulative Work
Remaining Cumulative Actual Work - Contains the amount of work that still needs to be completed on a task.
Formula: Remaining Cumulative Actual Work = Total Work – Cumulative Actual Work
Baseline Remaining Cumulative Work - Contains the remaining amount of time scheduled for all resources assigned to a task, when the baseline was set.
Formula: Baseline Remaining Cumulative Work = Remaining Cumulative Work (when the baseline is set)
Baseline Remaining Tasks - Contains the number of scheduled subtasks that remain to be completed on a given day for a summary.
Formula: Baseline Remaining Tasks = Remaining Tasks (when the baseline is set)
Remaining Tasks - Contains the total number of scheduled subtasks that remain to be completed for a summary task on a given day.
Formula: Remaining Tasks = Total number of scheduled tasks and subtasks – Number of subtasks and tasks that have a finish date on that day or earlier
Remaining Actual Tasks - Contains the total number of actual tasks and subtasks that remain to be completed on a given day for the entire project.
Example 1 of how to use the Burndown Report:
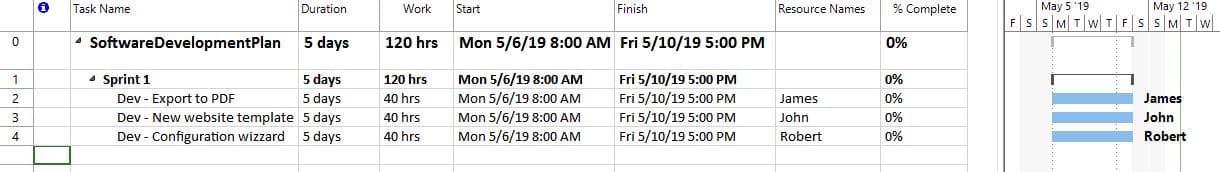
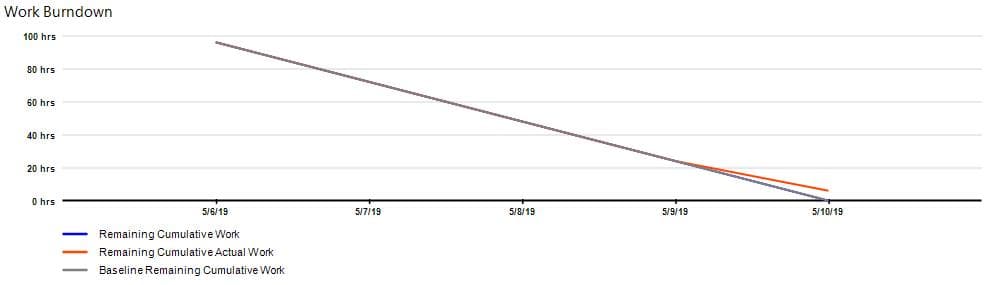
1. You have a project split into 1-week long sprints. The project start date is May 6th, 2019.
2. In your project, there are 3 resources: James, John and Robert.
3. You inserted one task (duration = 5 days/40 work hours) in Sprint 1 for each individual resource. The total work for Sprint 1 is 120 hours.
4. The Baseline is set on May 6th, 2019
5. Each resource completes 20% of his task daily.
6. On day 3 (May 8th), John completes only 5% of his task – Cumulative Actual Work is left behind.
Initial Burndown Report


Project status at the end of the day (after updates)
6th May – Everything looks fine.
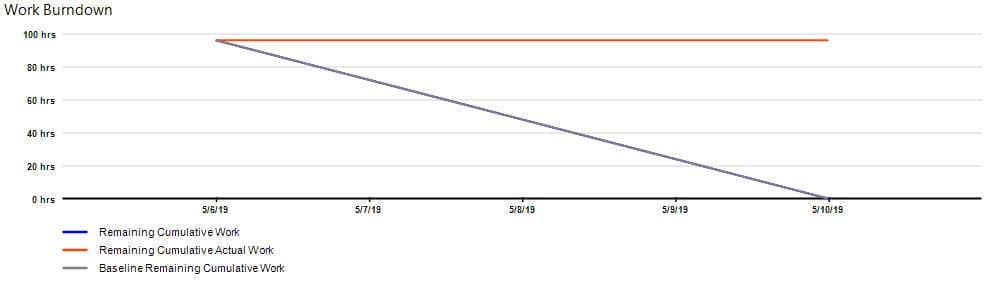
7th May – Everything looks fine.
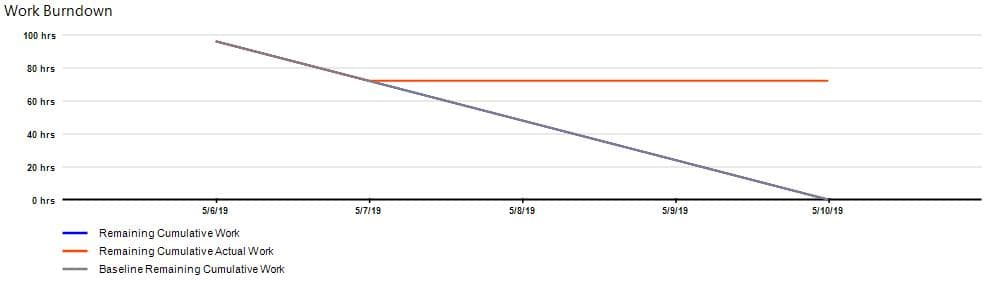
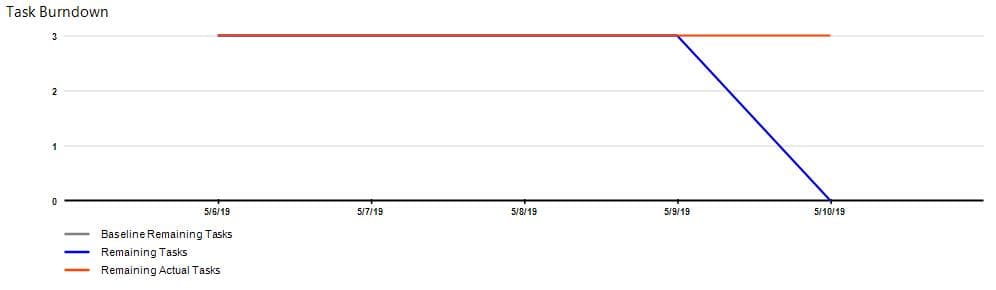
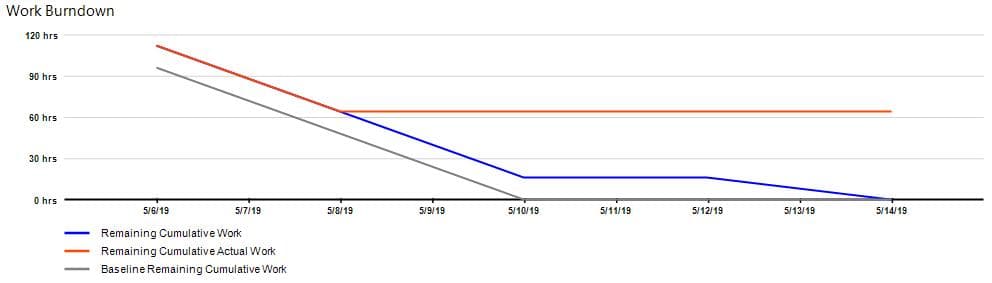
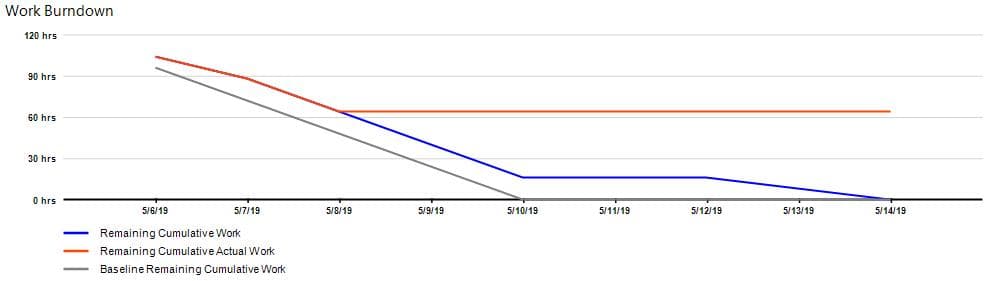
8th May – We observe that the Remaining Cumulative Actual Work is a little higher than expected on the 8th of May 2019.
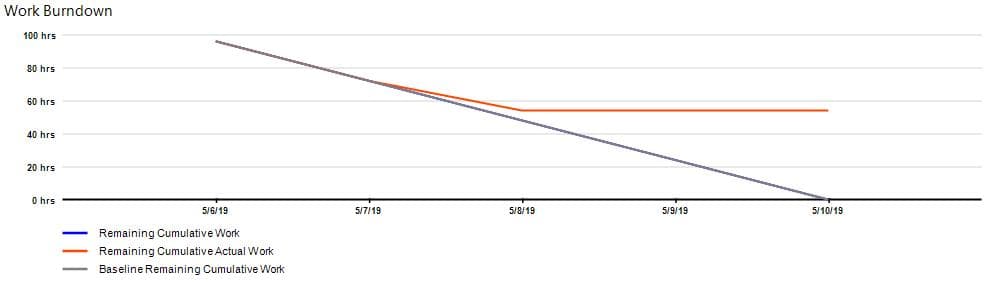
If we look at the project, we observe that John only completed 5% of his task (instead of the expected 20%).
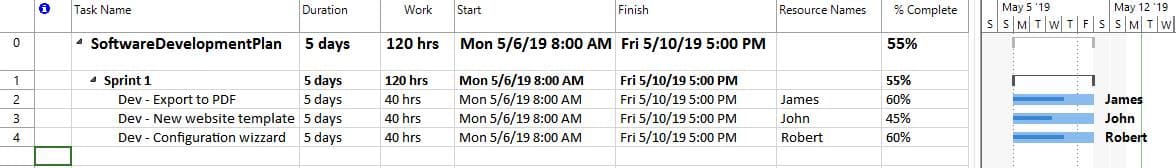
If John will not recover the 15% until 10th of May 2019, the final report will look like this:
Example 2 of how to use the Burndown Report:
1. You have a project split into 1-week long sprints. The project start date is May 6th, 2019.
2. In your project, there are 3 resources: James, John and Robert.
3. You inserted one task (duration = 5 days/40 work hours) in Sprint 1 for each individual resource. The total work for Sprint 1 is 120 hours.
4. The Baseline is set on May 6th, 2019
5. Each resource completes 20% of his task daily.
6. On day 3 (May 8th), John realizes that his task will take 7 days (instead of 5 days):
- Work Burndown – Remaining Cumulative Work is higher than Baseline Remaining Cumulative Work;
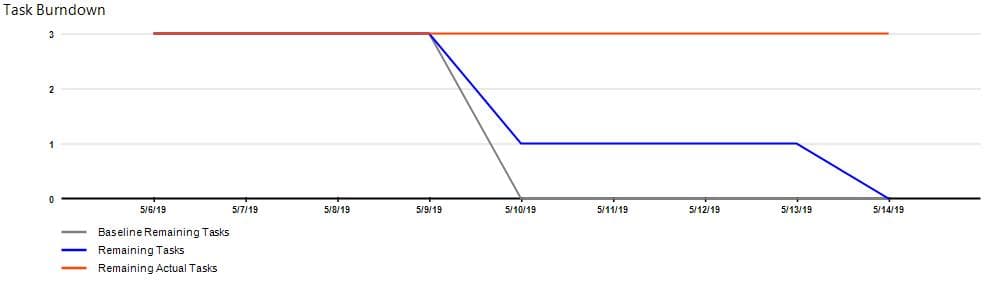
- Task Burndown – according to baseline, Remaining Tasks should be 0 by May 10th, which is not.
Initial Burndown Report

Project status at the end of the day (after updates)
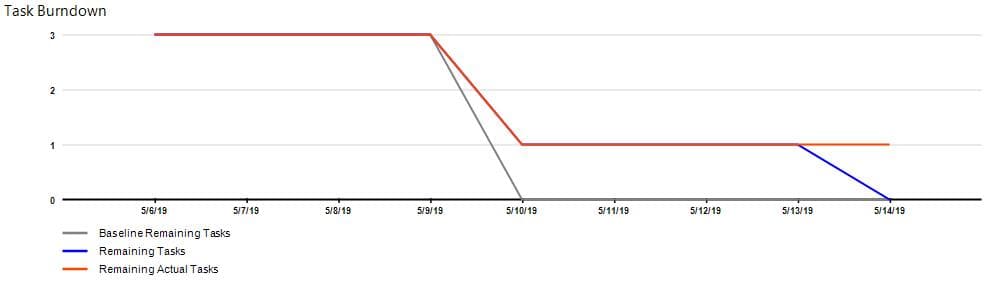
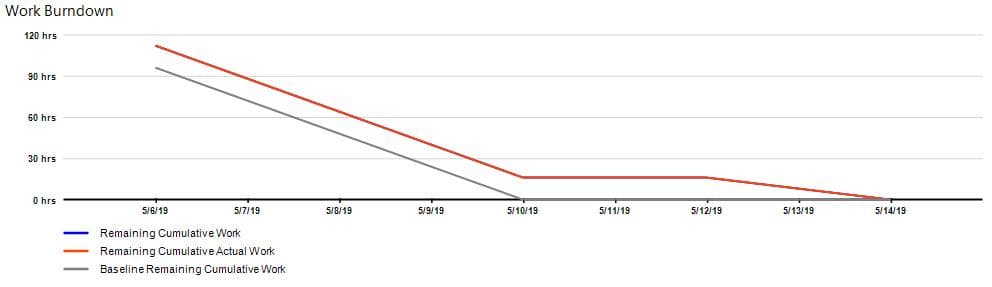
8th May – The Work Burndown chart tells us that we will be delayed by 16 work hours by May 10th (vs. Baseline), while the Task Burndown chart tells us that we are delayed by 1 task and the final day will be May 14th, instead of May 10th.
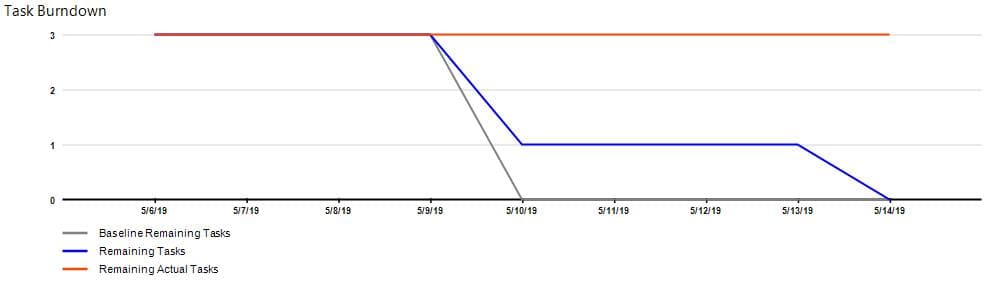
10th May – According to the baseline, today is the final day, but if we look on the charts, we see that we still have about 16 work hours to go (1 task – according to the Task Burndown chart).
Final
Example 3 of how to use the Burndown Report:
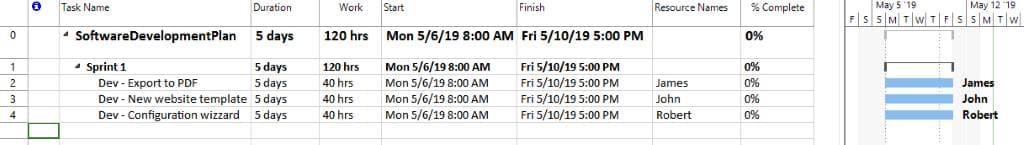
1. You have a project split into 1-week long sprints. The project start date is May 6th, 2019.
2. In your project, there are 3 resources: James, John and Robert.
3. You inserted one task (duration = 5 days/40 work hours) in Sprint 1 for each individual resource. The total work for Sprint 1 is 120 hours.
4. The Baseline is set on May 6th, 2019
5. Each resource completes 20% of his task daily.
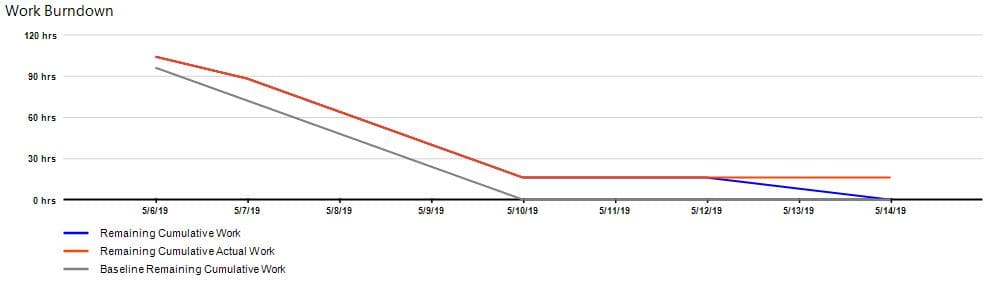
6. John realizes that he cannot start to work on his task until May 8th, so he moves it:
- Work Burndown – Remaining Cumulative Work is higher than Baseline Remaining Cumulative Work;
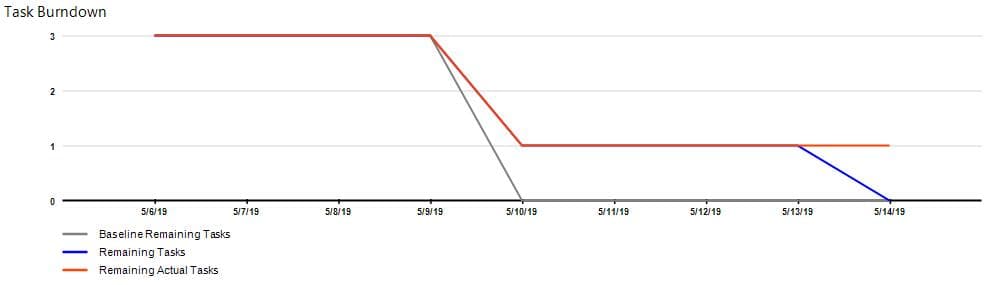
- Task Burndown – according to baseline, Remaining Tasks should be 0 by May 10th, which is not.
Initial Burndown Report

Project status at the end of the day (after updates)
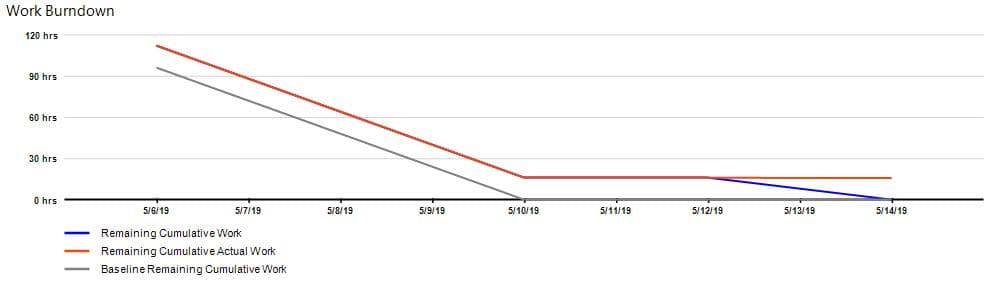
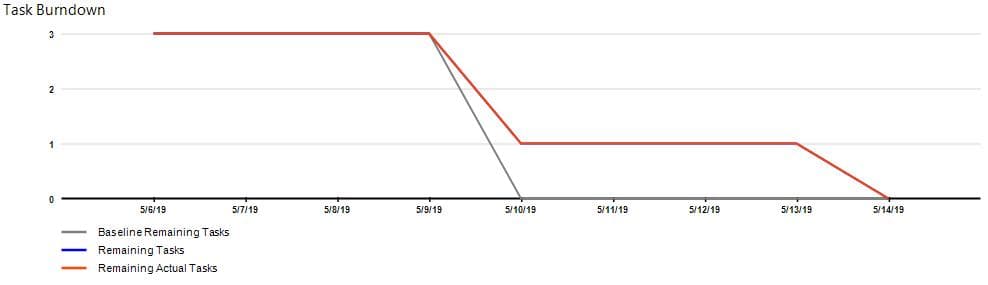
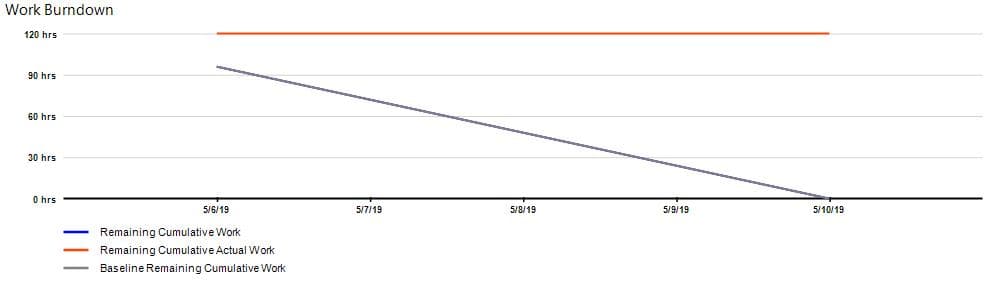
8th May – Observe the deviation versus the Baseline Remaining Cumulative work – 16 work hours / 1 task.
10th May – According to the baseline, today is the final day, but if we look on the charts, we see that we still have about 16 work hours to go (1 task – according to the Task Burndown chart).
Final
According to the charts, the project was delayed by 16 work hours / 1 task.