What does the "Dashboard" functionality do?
The Dashboard functionality allows you to aggregate multiple project files (either located on your machine or online) in a virtual master project to help you get a higher-level perspective on your projects.
What are the benefits of using the Dashboard functionality?
The Dashboard functionality offers the advantage of bringing projects together in order to analyze them, without having to manually insert them as subprojects into a master file expressly created for this purpose.
The feature is especially useful to observe resources – it is actually a frequent scenario that in overlapping projects considered individually resources are not overallocated, but when considered as a whole, shared resources across multiple projects are assigned to more work than the normal working capacity.
What does the “Help” button inside the Dashboard dialog do?
The “Help” button inside the “Dashboard” dialog redirects you to the “Dashboard” article in our Online Help page.
How do I create a dashboard file?
Before creating a Dashboard, you need to make sure that your projects are uniform:
- Resources shared across multiple projects must be identical in all projects (Name, Calendar, Max. Units, Std. Rate, Cost / Use,**** etc.) in order to be correctly aggregated.
- All included projects must have the same calendar options.
- Work must be entered in the same unit type in all projects (and selected as Work Unit in the New Dashboard dialog).
- All projects should have the same currency (and selected as dashboard Currency in the New Dashboard dialog). If a different currency is selected, no conversion will be performed.
Go to menu Report – Dashboard – Select the desired settings – click Save.
Is there any equivalent in the Mac version for Dashboard?
Please download and install our latest application from our website: https://www.projectplan365.com/download/.
Can I use the Dashboard functionality on the web application?
On the web application, you can only open an existing Dashboard file, but you cannot create a dashboard file.
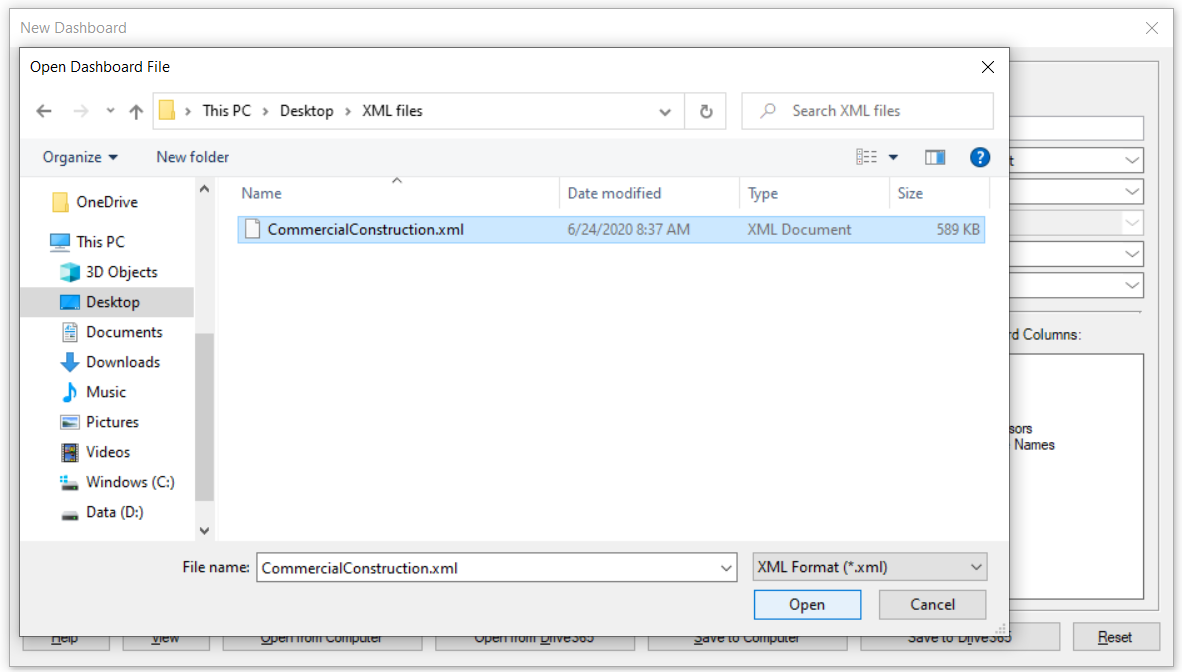
How do I open a dashboard file?
To open and existing Dashboards file click the Report Tab – Dashboard –Open – Select the dashboard file and make sure it is in XML format and click Open. The “Dashboard” option can also be found in File menu – Home tab – Dashboard.
Can I open Dashboard file from Drive 365 or upload files from Drive 365 in Dashboard?
At this point, you can open dashboard files from Drive 365 or upload files from Drive 365 in Dashboard dialog only in Project Plan 365 for Windows and Mac.
How can I upload files from Drive 365 cloud in Dashboard?
In order to upload Drive 365 files in Dashboard go to menu Report - Dashboard. In the Dashboard dialog, select from the dropdown Drive 365 and then click Browse. Sign in with your account, choose the desired document and then press OK.
How can I open dashboard files from Drive 365 cloud?
To open dashboard files from Drive 365, go to menu Report - Dashboard. In the Dashboard dialog select Open from Drive 365, use your account to sign in, choose the desired dashboard file and then press Open.
You can open dashboard files directly from Drive 365 cloud in the backstage. In order to do that, go to the menu File - Open - My Projects – Drive 365 and then select the desired dashboard file (the one with .xml extension) and press Open.
How can I save dashboard files to Drive 365 cloud?
You can save dashboard files in Drive 365 by using the Save to Drive 365 option in Dashboard dialog. In order to do that, go to menu Report - Dashboard. In the Dashboard dialog, upload the desired files and press Save to Drive 365. Type the dashboard file’s name and then press Save.
You can save dashboard files directly in Drive 365 in the backstage. To do so, go to the menu File - Save as - My Projects - Drive 365, type the dashboard file’s name and press Save.
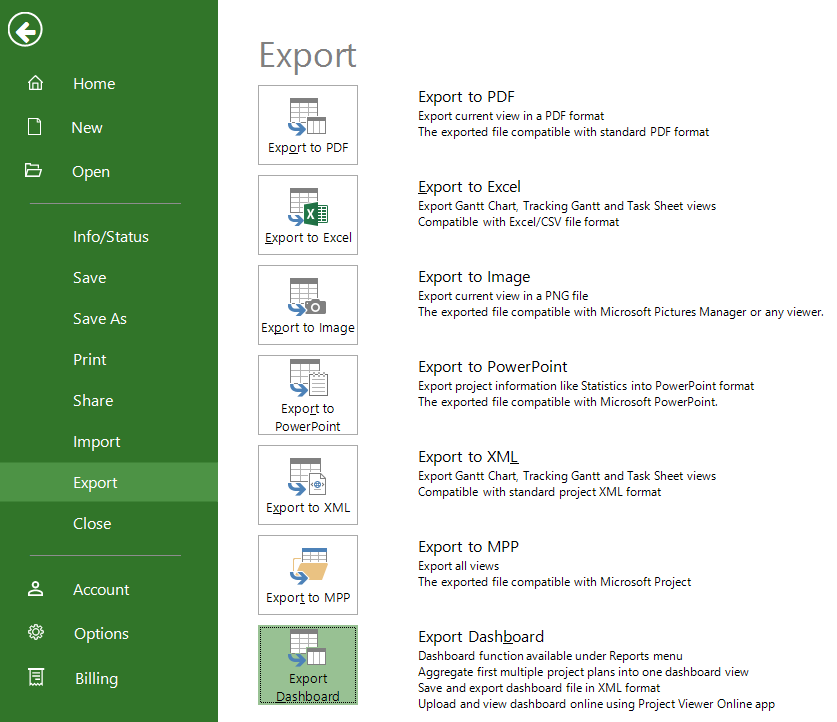
How do I export a dashboard project?
In order to export your dashboard, go to menu File - Export - Export Dashboard.
How can I add another project to an existing Dashboard Project?
In order to add another project to an existing Dashboard project, go to the Report menu - Dashboard and click on "Open from Computer" button - select the XML file and press Open. Then open again the Dashboard dialog and add another project and click on "View".
Why I can’t see the “Dashboard” button in ribbon on the Mac platform?
If the “Dashboard” button is not visible in ribbon, please press "More" button. You should be able to find in the dropdown the button that doesn't fit inside the ribbon because of the small window size.
Does the Project Plan 365 application have the option to unify multiple projects?
You can use the Dashboard functionality. In order to do that, please go to the Report menu - Dashboard. From the left side of the dialog, select the projects, configure the Dashboard settings and press the "View" button.
How can I save my Dashboard file to computer?
You can save dashboard files on your Computer by using the Save to Computer option in Dashboard dialog. In order to do that, go to menu Report - Dashboard. In the Dashboard dialog, upload the desired files and press Save to Computer. Type the dashboard file’s name and then press Save.
Step by step on how to create a dashboard:
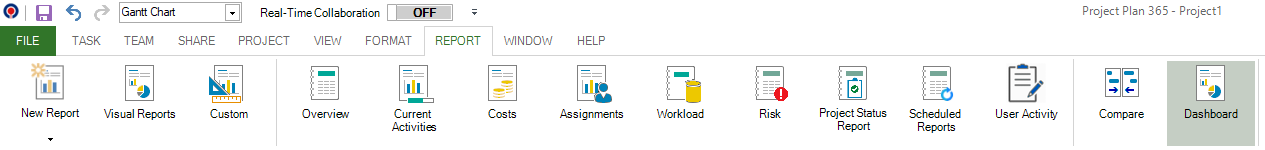
1. Create a new dashboard file by going to menu Report - Dashboard.
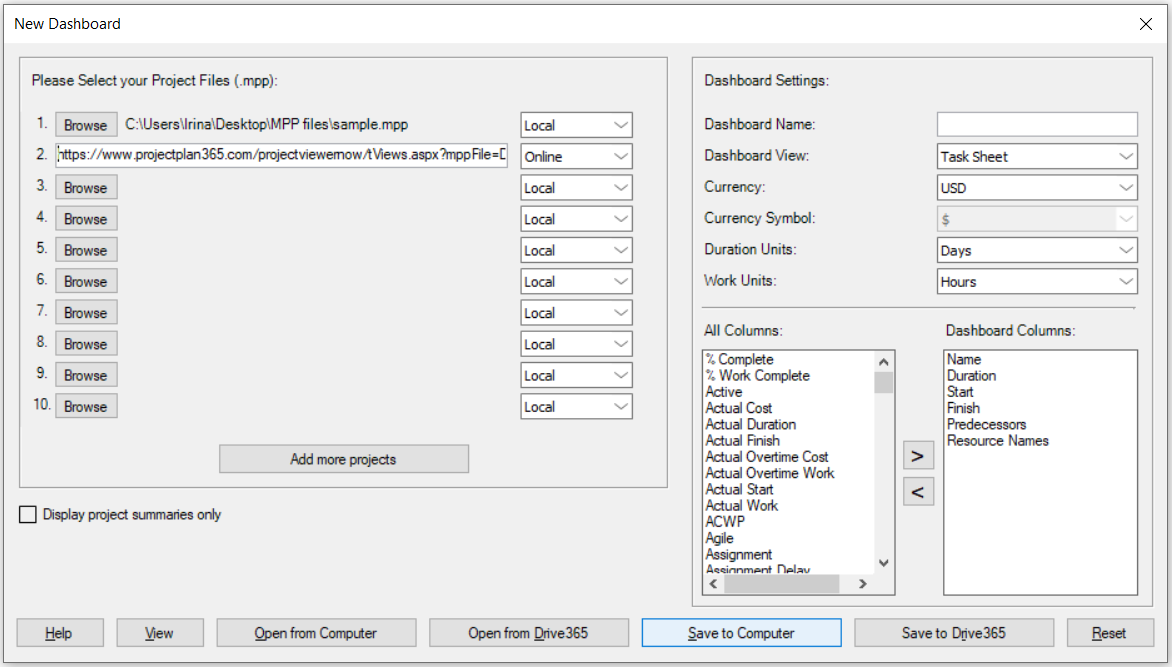
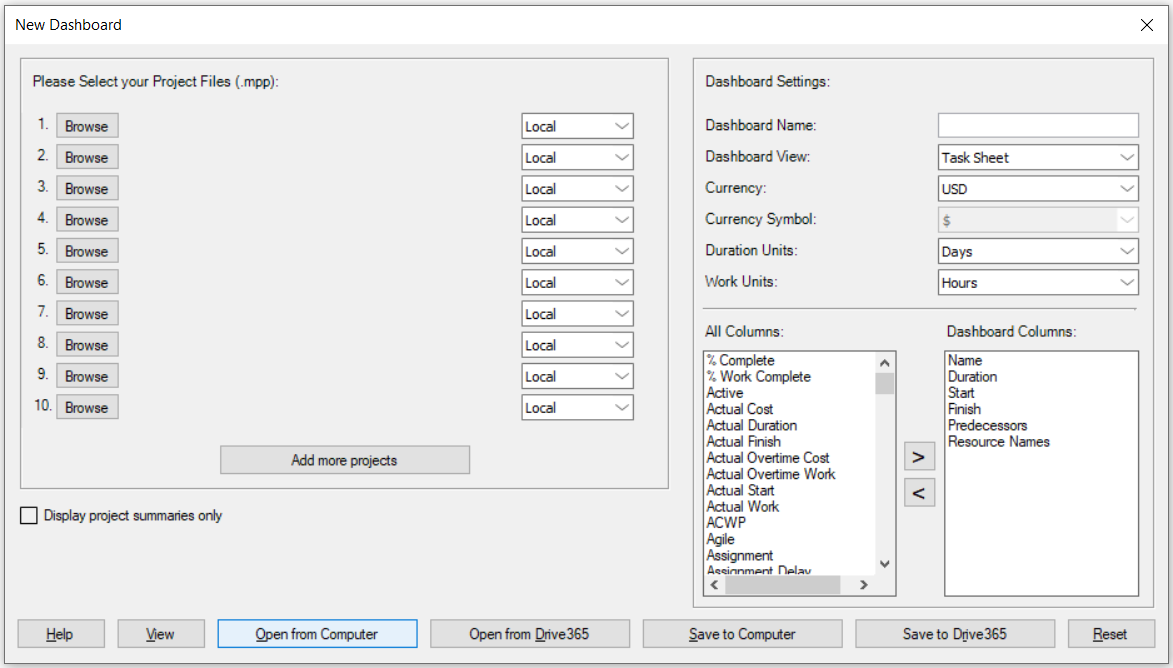
2. You will then be presented with the New Dashboard.
3. On the left side of the dialog, select the projects.
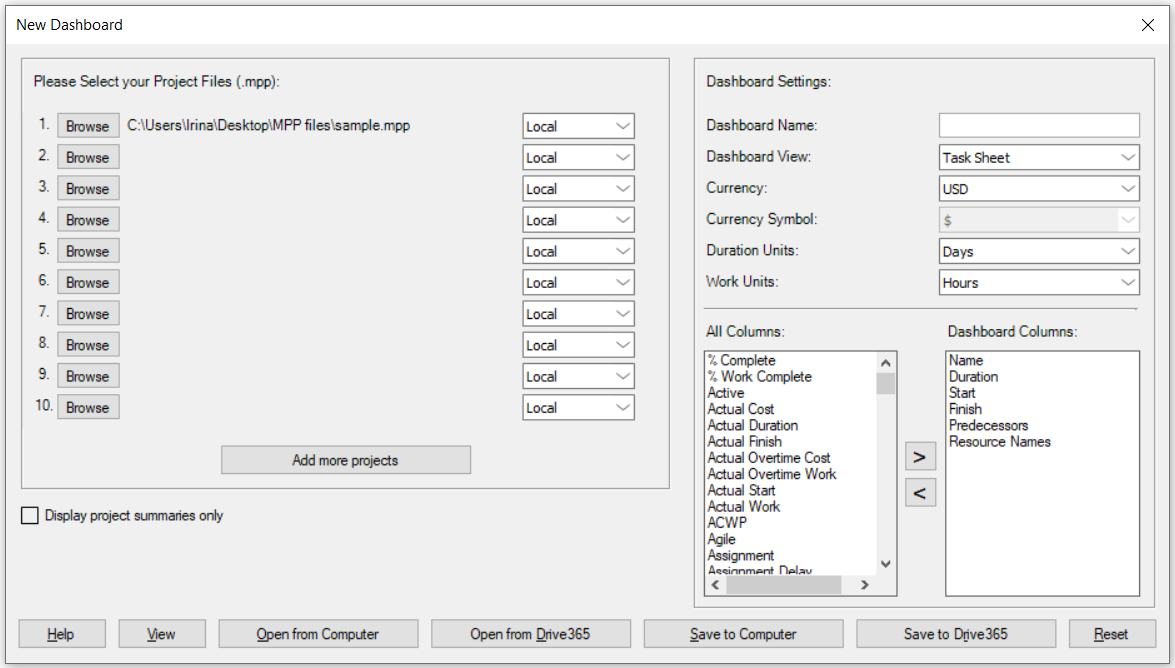
More than the default 10 projects can be added, by clicking on the Add more projects button.
If you want your dashboard to load faster, you can check the Display project summaries only box, but this option will not display subtasks, resources or assignments.
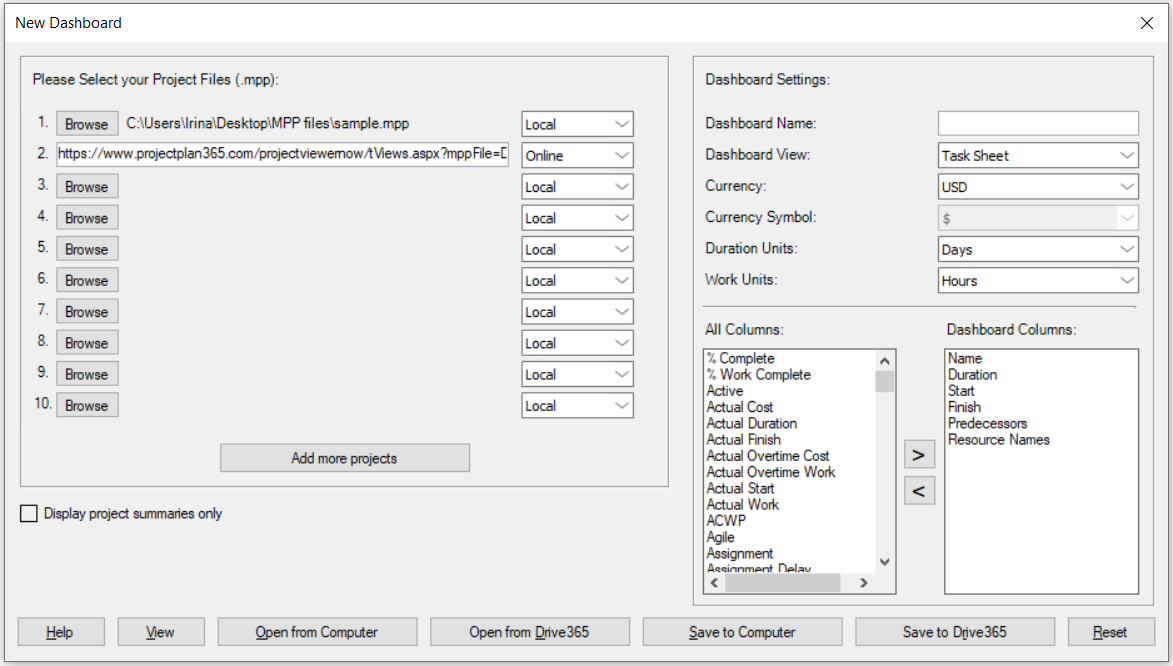
Currently, local, Drive 365 cloud and online files are supported. Hit Browse to select a file on your hard drive, chose Drive 365 from drop down list use your account to sign in then select desired file from file picker or choose Online from the drop down list and insert the URL file (starting with http://).
According to our scenario, after selecting the projects, this side of the dialog will look as follows:
4. Now that the files are selected, we need to configure the Dashboard settings, according to the projects’ settings and the viewing preferences.
The default Dashboard view is Task Sheet and it is also the only one that allows choosing the columns to be displayed on rendering.
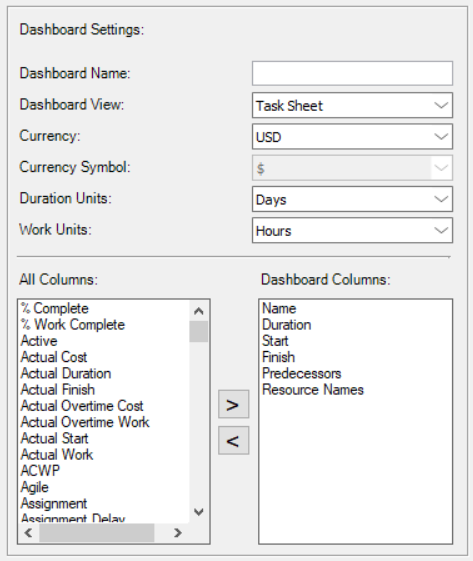
Dashboard Settings:
- Dashboard Name – the name of the dashboard project (if left blank, dashboard will be set by default).
- Dashboard View – one of the main views: Task Sheet, Gantt Chart, Tracking Gantt, Task Usage, Calendar, Resource Sheet, Resource Usage, Resource Graph, Team Planner, Network Diagram.
- Currency – allowed currencies are USD, AUD, BRL, CAD, CHF, CNY, DKK, EUR, GBP, HKD, HUF, JPY, MXN, NOK, NZD, RON, SEK, ZAR. All projects should have the same currency and this is the currency you have to select here. If a different currency is selected, no conversion will be performed.
- Currency Symbol – the corresponding symbol for the currency selected above.
- Duration Units – Minutes, Hours, Days, Week, Months. The default duration unit is Days. It is recommended for this setting to be the same with the ones in the compound projects.
- Work Units – Minutes, Hours, Days, Week, Months. The default duration unit is Hours. It is recommended for this setting to be the same with the ones in the compound projects.
Dashboard Columns:
The default columns are those of the Entry Table:
- Name
- Duration
- Start
- Finish
- Predecessors
- Resource Names
Note: To add a column to this list, you need to select a column from the left list and press the " > " button. To exclude a column, you need to select it from the right list and then press the " < " button.
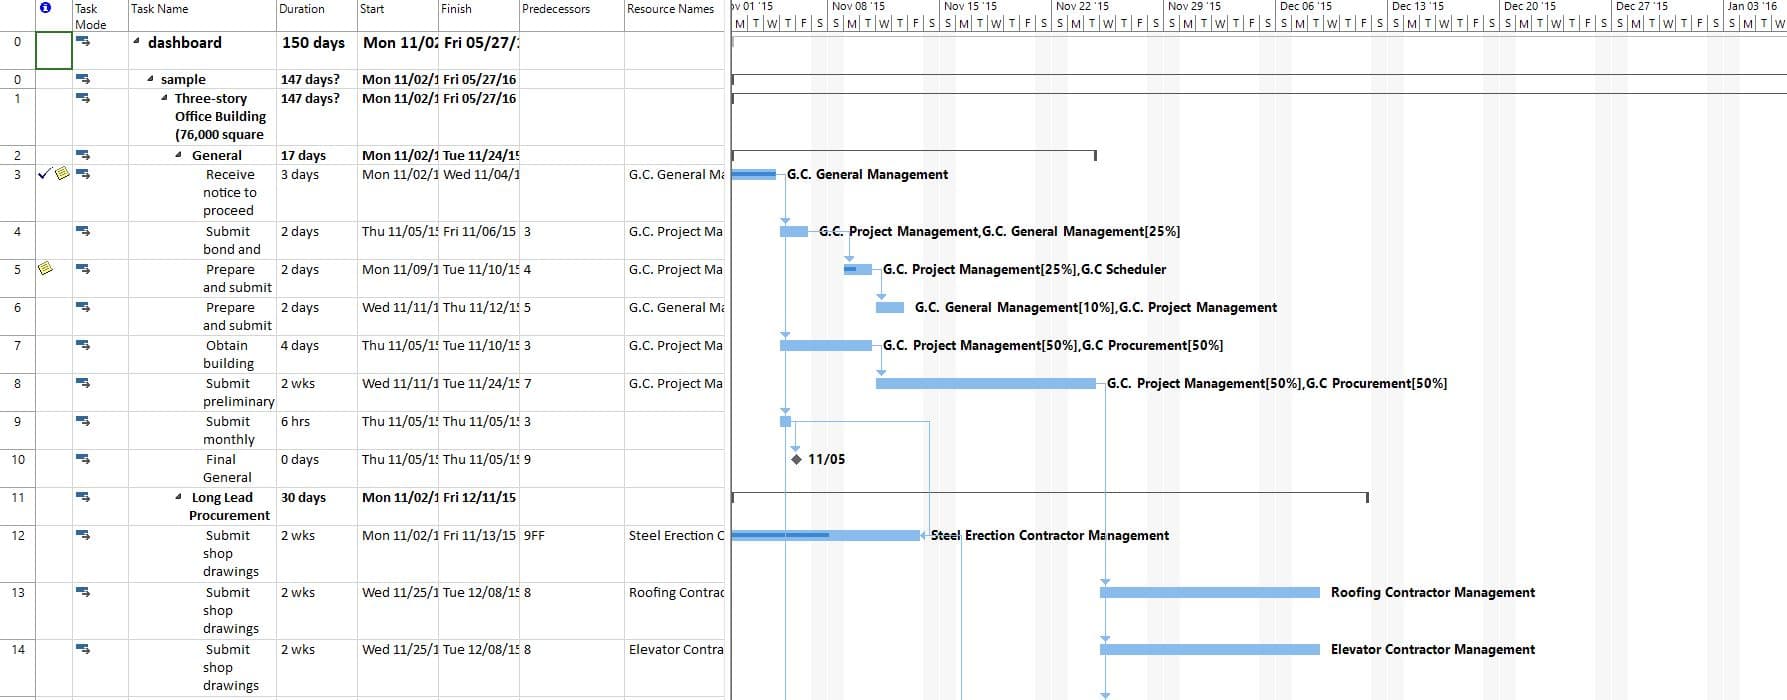
5. If you are ok with your options, simply hit Enter or press the View button.
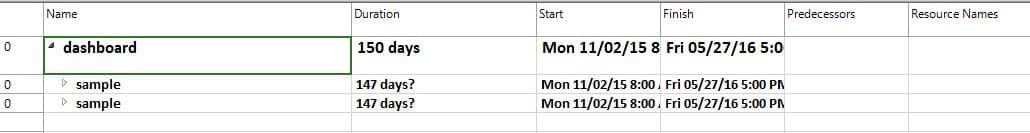
6. You will initially see the dashboard project summary, along with the projects' summary tasks, which you can expand afterwards if you please.
The Dashboard summary Start is given by the earliest Start date of all its subtasks. The Finish is given by the latest Finish date.
You can now browse through all the available views, like with any regular project file.
7. As entering the project paths and settings every time for each session can get a bit tedious, you have the option of saving a custom XML file containing all these pieces of information, so that the next time all you will have to do is to open this file.
You don't have to worry if you didn't do this from the beginning. If you re-enter the Dashboard menu, you will see that all the fields in the dialog are restored to their last values.
The Reset button will restore all the fields to their default value (i.e. no project files selected, default settings and columns).
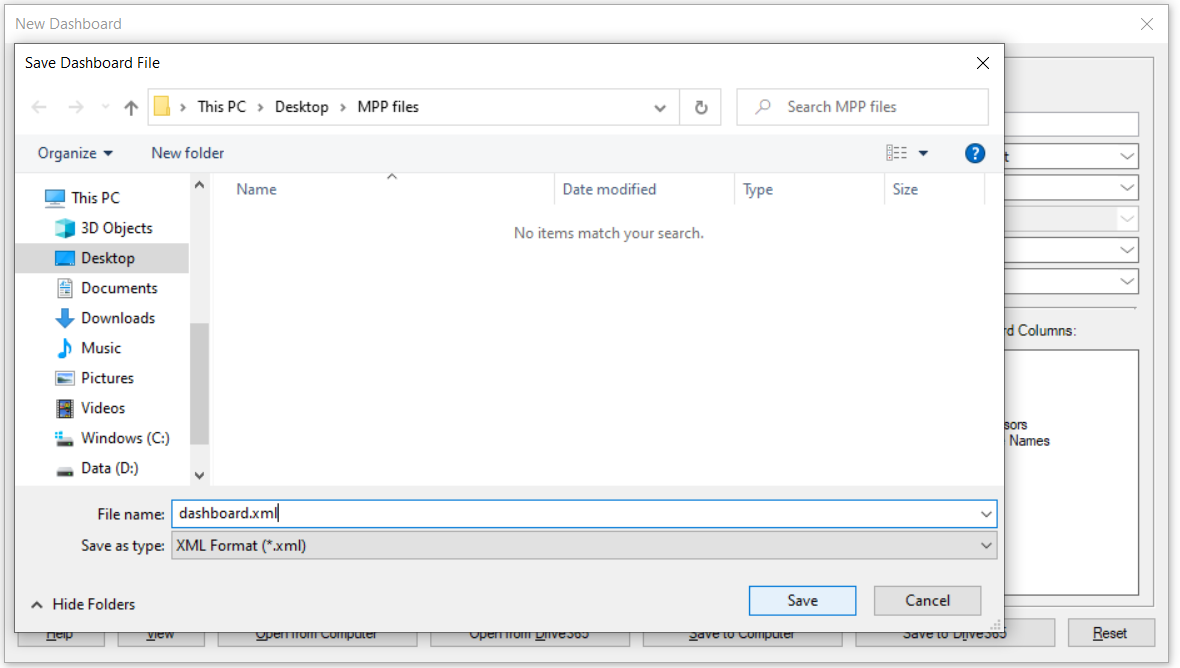
8. Click Save to Computer or Save to Drive365.
9. Insert the desired name and location then click on Save.
Step by step on how to open a previously created dashboard file:
1. Go to to menu Report - Dashboard.
2. Click Open.
3. Select the desired dashboard file and click Open.
Note: You can always go back to the Dashboard dialog and change dashboard settings or add more projects if you want to. Save is only necessary when you want to review the dashboard in a future session.
Step by step on how to export a dashboard project:
1. Go to menu File - Export - Export Dashboard.
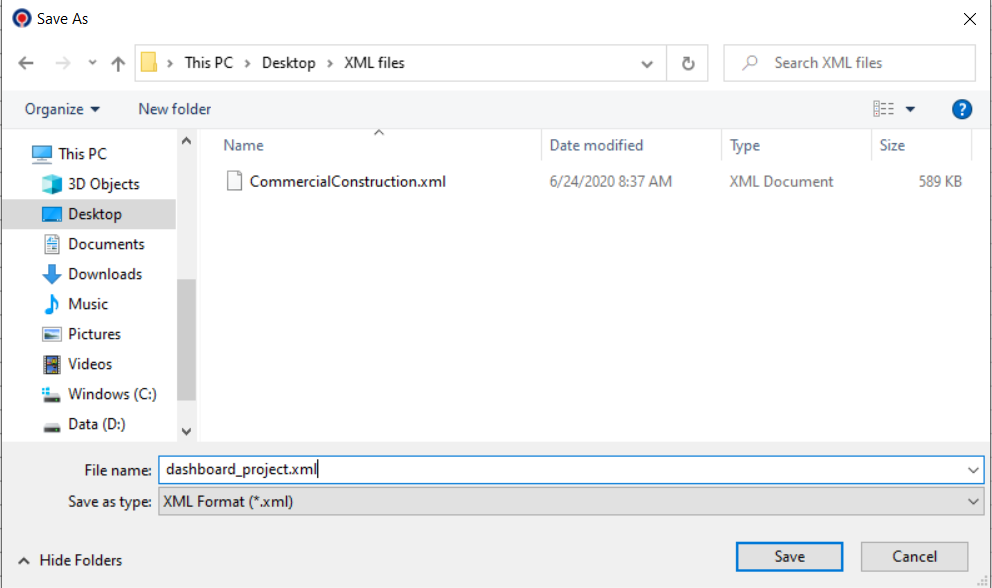
2. Insert the desired name and click Save.
Note: A dashboard project suitable for the Project Plan 365 application is a regular XML project file which contains additionally some dashboard preferences regarding the default view and the columns that will be displayed. The dashboard export is done in a what-you-see-is-what-you-get manner, meaning that the view and columns shown at the moment of the export will be those displayed when importing the dashboard project.
The default name for saving is the dashboard name + the suffix “_project.xml” to make it easier to differentiate between the dashboard configuration file which only contains the project paths and preferences and where all the indicated projects are loaded and processed on every opening and the actual dashboard project which is already processed and can be exported to xml format, like any other project, but with some preferences stored, in order to make it easy for you to visualize the projects as you want to, without additional effort. Please do not confuse these two formats.
Advantages of using the Dashboard functionality
1. The main purpose of the Dashboard feature is getting a higher-level perspective on your projects:
2. Overall duration, costs and work, as well as actual / remaining values of these fields can provide a project manager with an up-to-date global assessment of how the projects are going according to plan. Dashboard makes all these easy to keep track of.
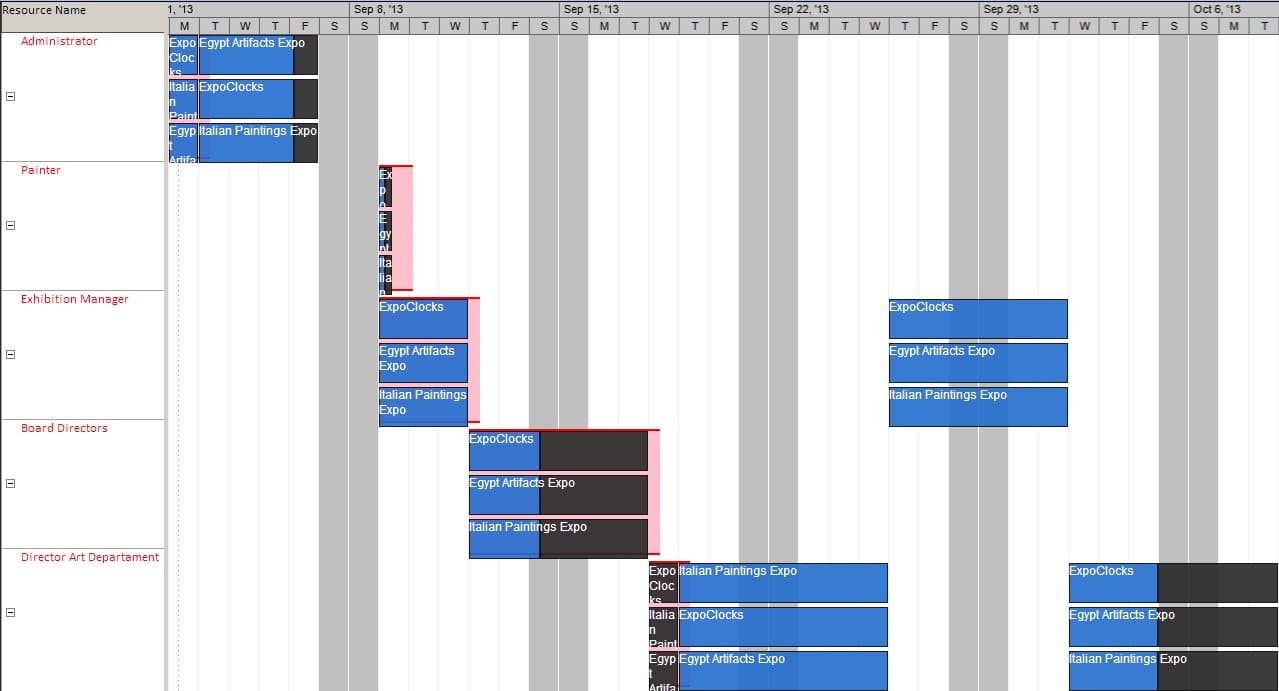
3. The Dashboard feature is also particularly helpful for observing your resources and their assigned work at global level, as well as overallocations of shared resources across multiple projects:
Let’s take a look at the resources’ situation in the three projects used in our scenario:
ExpoClock.mpp
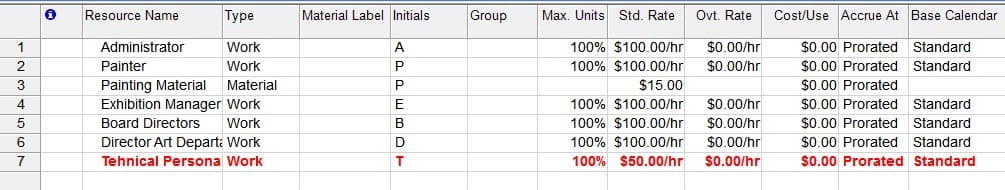
Egypt Artifacts Expo.mpp
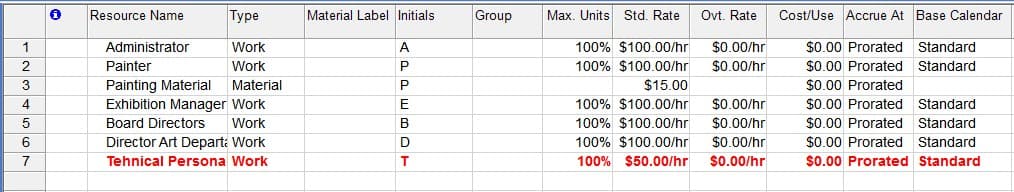
Italian Paints Expo.mpp
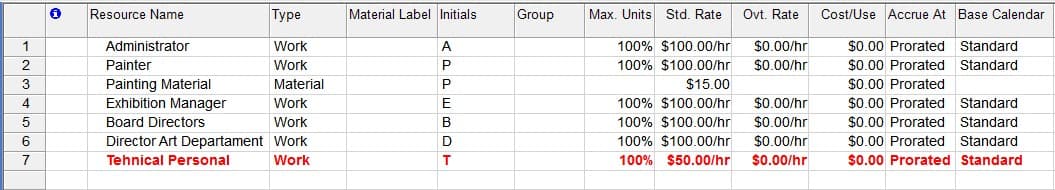
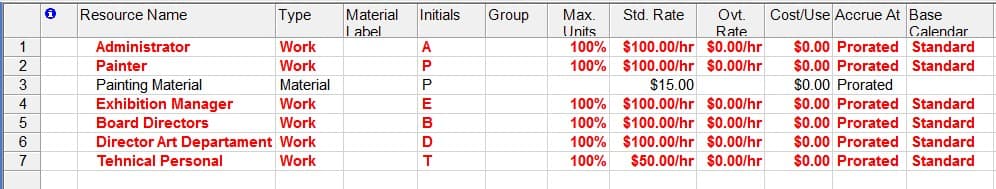
In each project, Technical Personal is the only overallocated resource. But looking at the dashboard Resource Sheet, we see that all the work resources are overallocated, at global level:
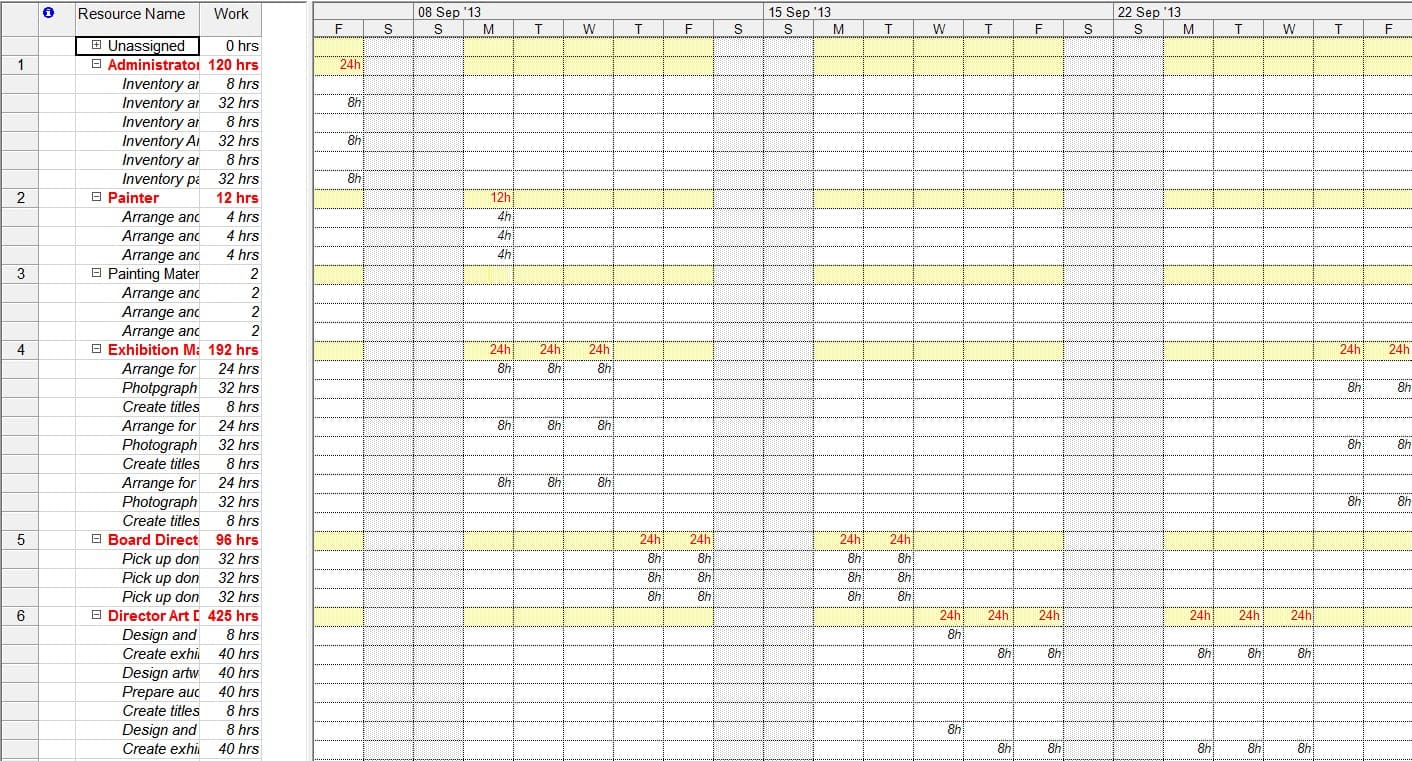
4. Overallocations at dashboard-level can be analyzed in depth by using, for instance, the Resource Usage view.
5. Overallocation can be viewed also in the Team Planner view.