What does “Network Diagram” functionality do?
The Network Diagram functionality allows a visual representation of the project plan. It represents tasks and task dependencies. A box (also called a node) represents each task, and a line connecting two boxes represents the dependency between two tasks.
What is Network diagram?
A network diagram is a graphical representation of the tasks in the project in the form of a directed graph: the tasks are vertices and the interdependencies among tasks are arcs.
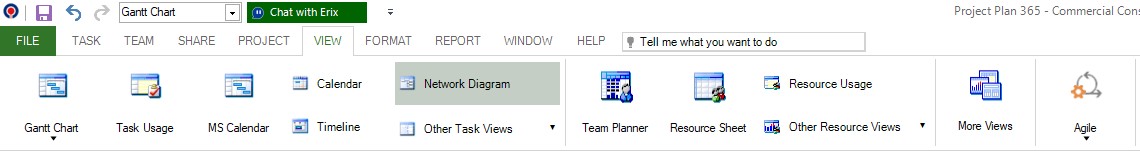
Where is the Network Diagram view?
In order to use the Network Diagram view, go to the menu View - Network Diagram.
What are the best uses for Network Diagram view?
Use the Network Diagram view to:
- View your schedule in a flowchart format.
- View the task information in the network diagram boxes.
- View tasks links to specify the task sequence and to determine start and finish
- Graphically show completed, in-progress, and not-yet-started tasks.
- View assigned personnel and other resources, such as equipment, to specific tasks.
What can I customize in Network Diagram view?
In the Network Diagram view you can expand or collapse the network diagram to the level you want to see, by showing and hiding the subtasks of summary tasks.
What represent nodes in a Network Diagram?
Nodes in a Network Diagram or boxes represent each task with its related data.
How can I hide the start and end date in the Network Diagram view?
We are sorry, but you cannot hide the start/end date in Network Diagram view at this point.
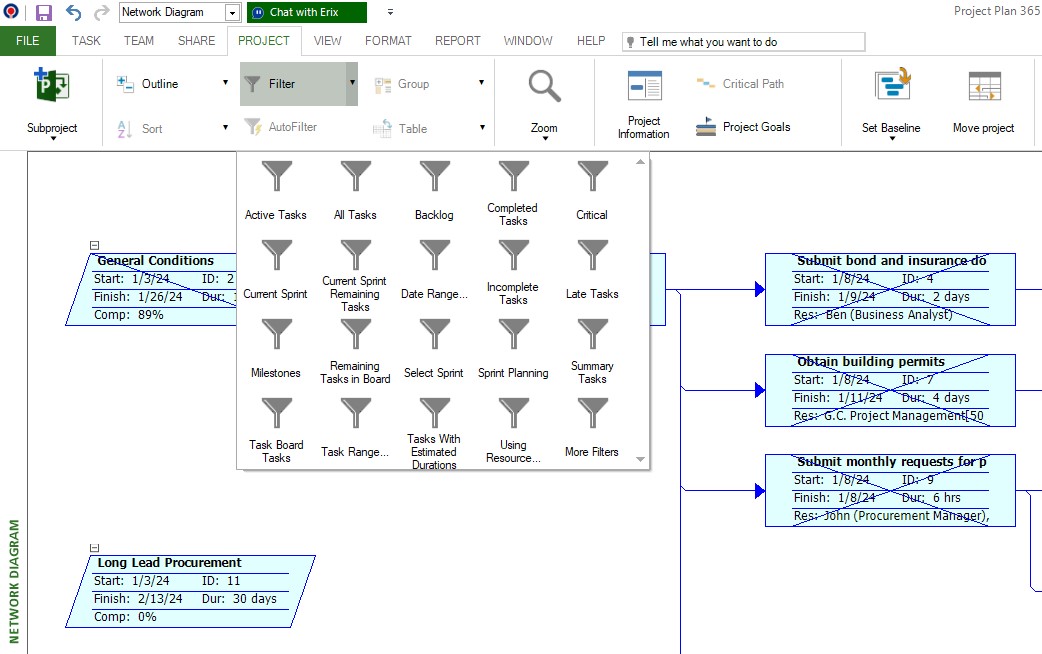
Can I use filters in a Network Diagram?
The Network Diagram view can use any of the task filters to display only the tasks you want to see. When you select a filter, the Network Diagram view displays the information as defined by that filter's criteria. The default filter is the All Tasks filter.
How do I format the Network Diagram?
For the moment the Network Diagram is view-only.
How can I draw PERT chart?
The PERT chart is called the Network Diagram in Project Plan 365 app. You can view the Network Diagram view by going to menu View - Network Diagram.
Where do I find box styles for Network Diagram view?
We are sorry, but you cannot change the box style in Network Diagram view.
How can I draw PERT chart?
The PERT chart is called the Network Diagram in Project Plan 365 app. You can view the Network Diagram view by going to menu View - Network Diagram.
How do I print the Network Diagram view?
To print the Network Diagram view, please go to menu View – Network Diagram. Then, go to menu File – Print – Page Setup and make the desired changes. After this, you can export the Network Diagram view to PDF.
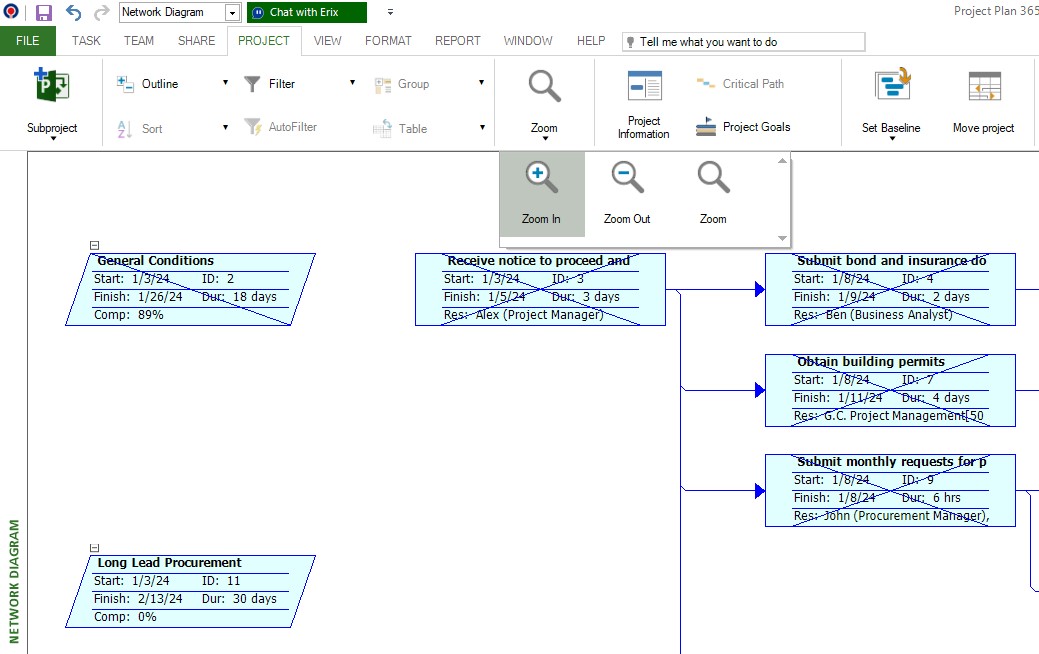
How do I zoom in/out in the Network Diagram view?
In Network Diagram view, you can zoom out to a bigger picture of your project's tasks by displaying at a higher level the sequencing of boxes corresponding and the links between them, or you can zoom in to see in more detail the boxes corresponding to your project's tasks. Additionally you can choose a custom value for the zoom level. To zoom in/out, please go to menu Project - Zoom.
Is there any way to set a default view?
To set a view by default, the Editor needs to save the file with that specific view being opened.
What does the diagonal line from the Network Diagram boxes mean?
The diagonal line from the Network Diagram boxes represent the tasks that are in progress.
The crossed diagonal lines from the boxes represent the tasks that are completed.
Why I can’t see the “Network Diagram” button in ribbon on the Mac platform?
If the “Network Diagram” button is not visible in ribbon, please press "More" button. You should be able to find in the dropdown the button that doesn't fit inside the ribbon because of the small window size.
How can I export the Network Diagram view to image?
In order to export the Network Diagram view to image, go to the "Share" menu and select "Export to Image" option.
How can I extract a WBS chart or diagram corresponding to the project tasks?
You can see the Network Diagram by going to menu View-Network Diagram or you can select the view in the right bar.
To export the Network Diagram, please go to menu View-Network Diagram then go to menu File-Print.
To see the WBS you can insert the WBS column by going to menu Format-Insert columns. Select WBS and click OK.
Another way to see the WBS is to add the outline number in the Task Name column by going to menu File-Options and in Advanced tab select “Show outline number”.
How can I take a full screenshot of the Network Diagram view?
To take a full screenshot of the Network Diagram view, you can export the entire view on one page. To achieve this, go to menu File - Print. Click on the Page Setup button and a dialog will open and you will see that there is the Scaling option. Check the option Fit to 1 page wide by 1 tall. Then, go to menu File-Export-Export to PDF.
How to export the WBS structure?
To Export the WBS structure, first you have to go to the Network Diagram View then to File menu – Export and select in what format you want to export the WBS.
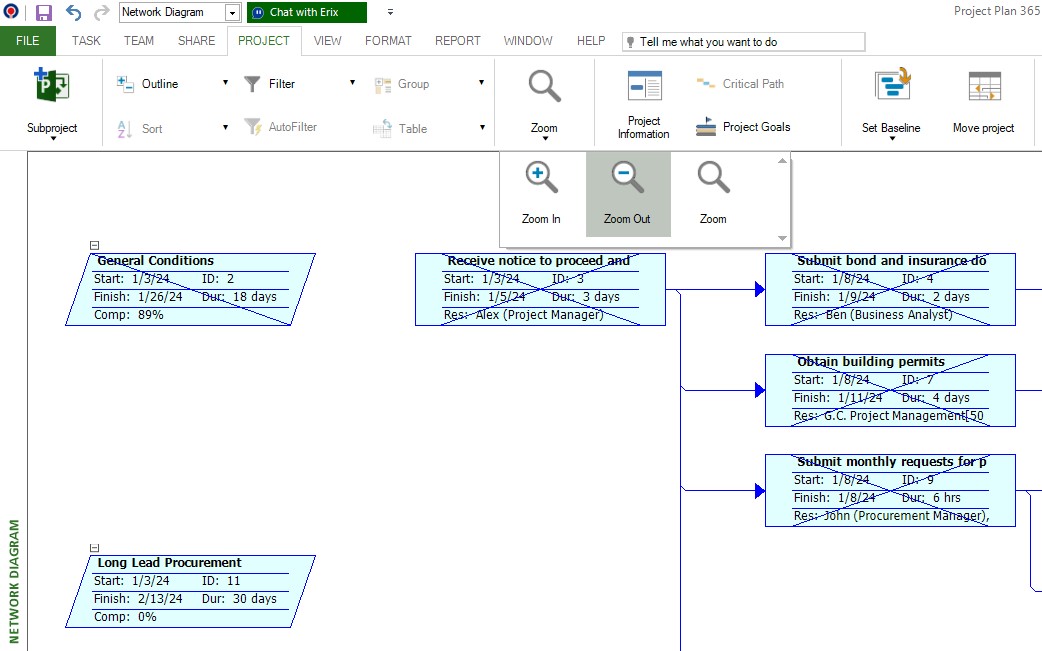
How do I make the Network Diagram view smaller? I want a smaller font so I can see more on the screen.
In order to reduce the Network Diagram view, you can use the Zoom Out option. In order to that, go to the Project menu select the Zoom option and click on the Zoom Out.
How can I display “Late Start” and “Late Finish” dates in the Network Diagram view?
We are sorry but the Network Diagram is view-only and displaying “Late Start” and ‘Late Finish” dates to the task boxes is not possible at this point.
How can I identify the critical tasks in the Network Diagram view?
The Critical Tasks automatically appear highlighted with red in the Network Diagram view.
How can I show only the critical tasks in the Network Diagram view?
To show only the Critical Tasks in the Network Diagram view, you can apply the "Critical" filter by going to menu Project – Filter - Critical.
How can I change the link style in the Network Diagram view?
We are sorry, but at this point, you cannot change the link style in Network Diagram view as it is view-only.
How to expand/collapse tasks in network diagram?
To expand/collapse tasks in the Network Diagram view, click on the “+/-” buttons above the summary task boxes.
Step by step on how to use the Network Diagram view:
1. In the View Bar, select Network Diagram.
2. You will notice that the view changes. Using the Network Diagram view, you can review your project tasks and task dependencies as a network diagram (or flowchart). A box (also called a node) represents each task, and a line connecting two boxes represents the dependency between two tasks. By default, the Network Diagram view displays one diagonal line through a task that is in progress and crossed diagonal lines through a completed task.

3. Use any of task filters to display only the tasks you want to see. Go to Project – Filter. When you select a filter, the Network Diagram view displays the information as defined by that filter's criteria. The default filter is the All Tasks filter.
4. You can zoom out to a bigger picture of your project's tasks by displaying at a higher level the sequencing of boxes corresponding and the links between them.
Or you can zoom in to see in more detail the boxes corresponding to your project's tasks. Additionally, you can choose a custom value for the zoom level.