What is the Visual Reports functionality?
The Visual Reports in Project Plan 365 are customizable reports that include both formatted text and graphics to display information from a Microsoft Project (.MPP) project file. These reports provide users with a clear and concise overview of project status, progress, and performance.
Where can I find the Visual Reports functionality?
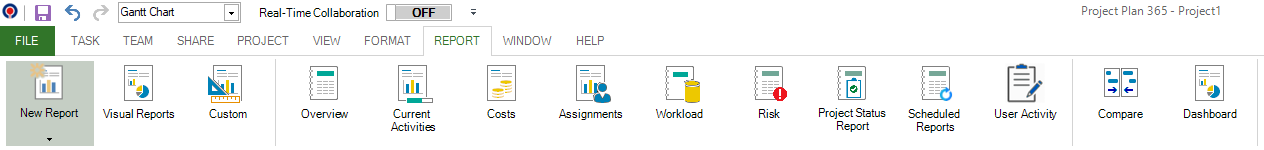
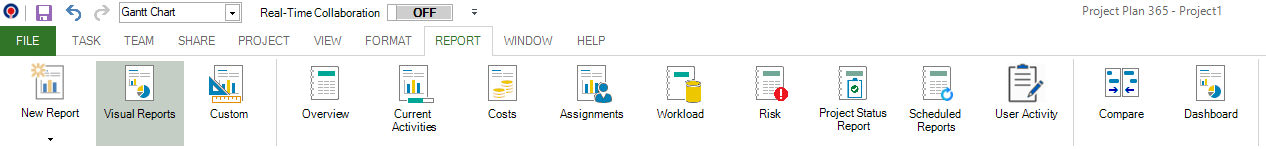
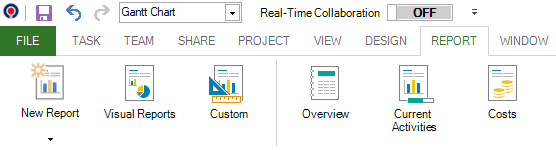
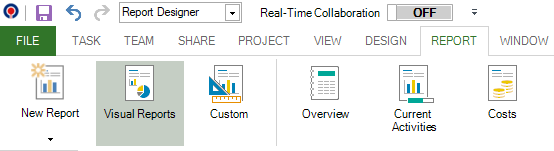
You can find the Visual Reports functionality by going to menu Report – Visual Reports button.
How can I create a visual report from scratch?
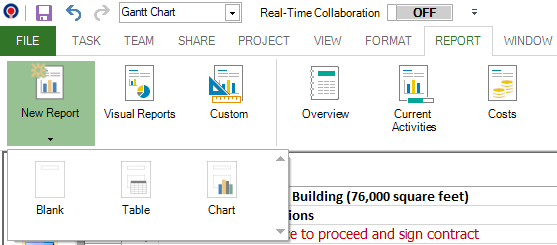
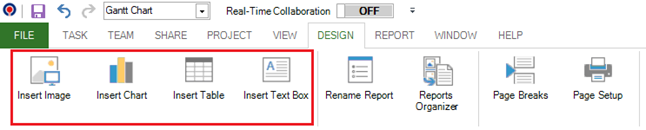
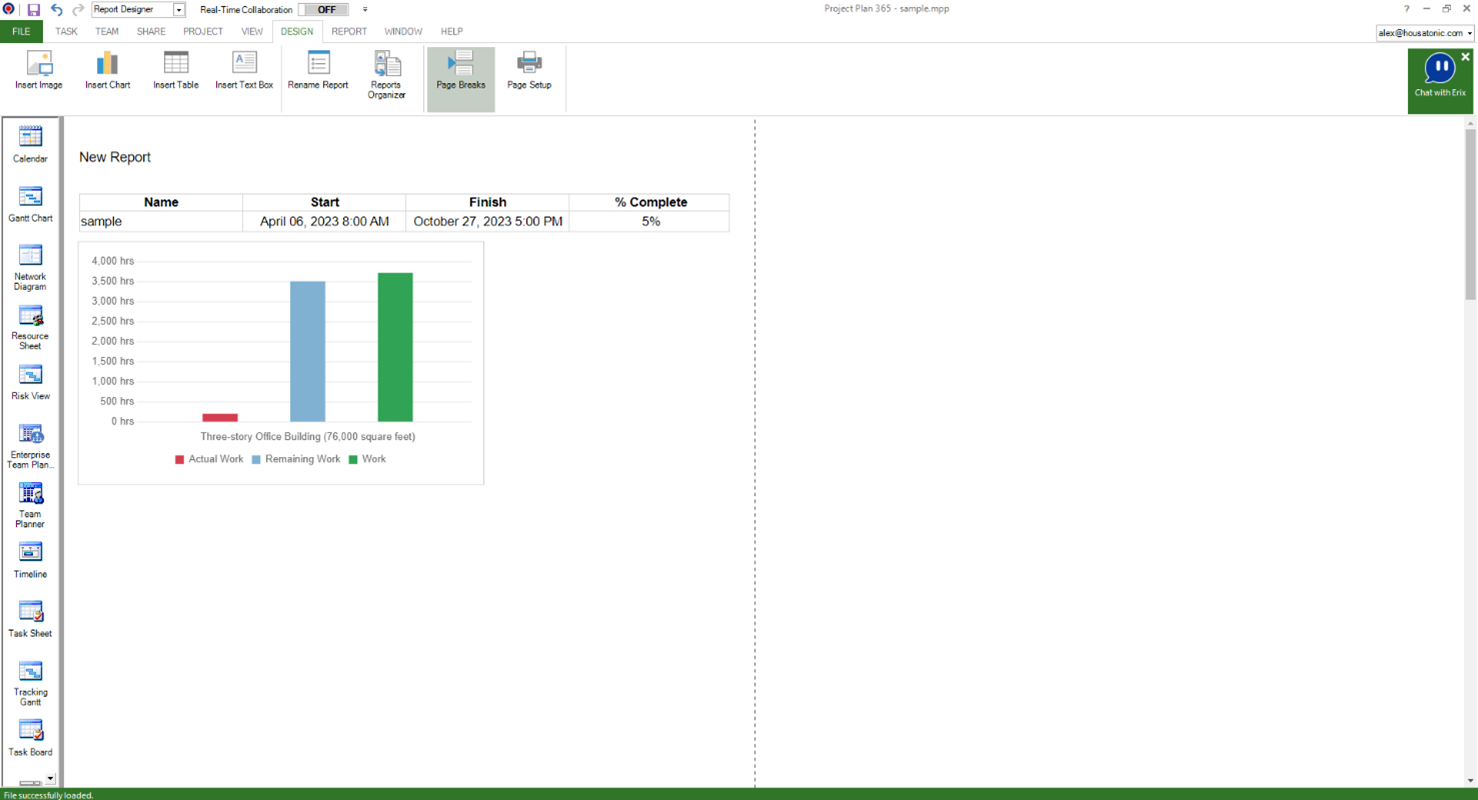
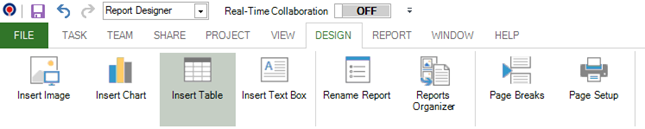
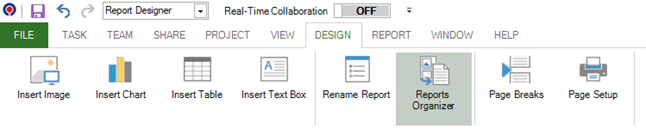
To create a visual report, go to menu Report – New Report – select one of the three options: Blank/Chart/Table. Type in a name to your report and click OK. A new Design menu will become available where you can add and customize the report elements.
Blank – creates a blank canvas. Allows you to create a report from scratch, adding text boxes, images, and other elements as needed. This is a good option if you want complete control over the design of your report.
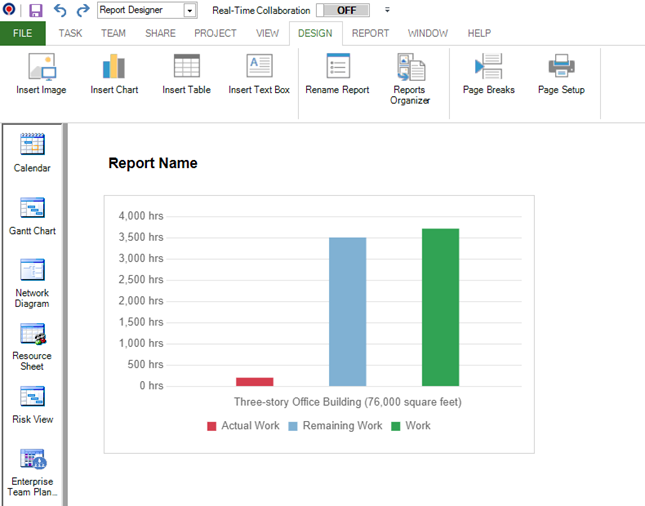
Chart – creates a chart comparing Actual Work, Remaining Work, and Work by default. Allows you to create a report that displays data in a chart or graph format. You can choose from several chart types, such as bar charts, pie charts, and line graphs.
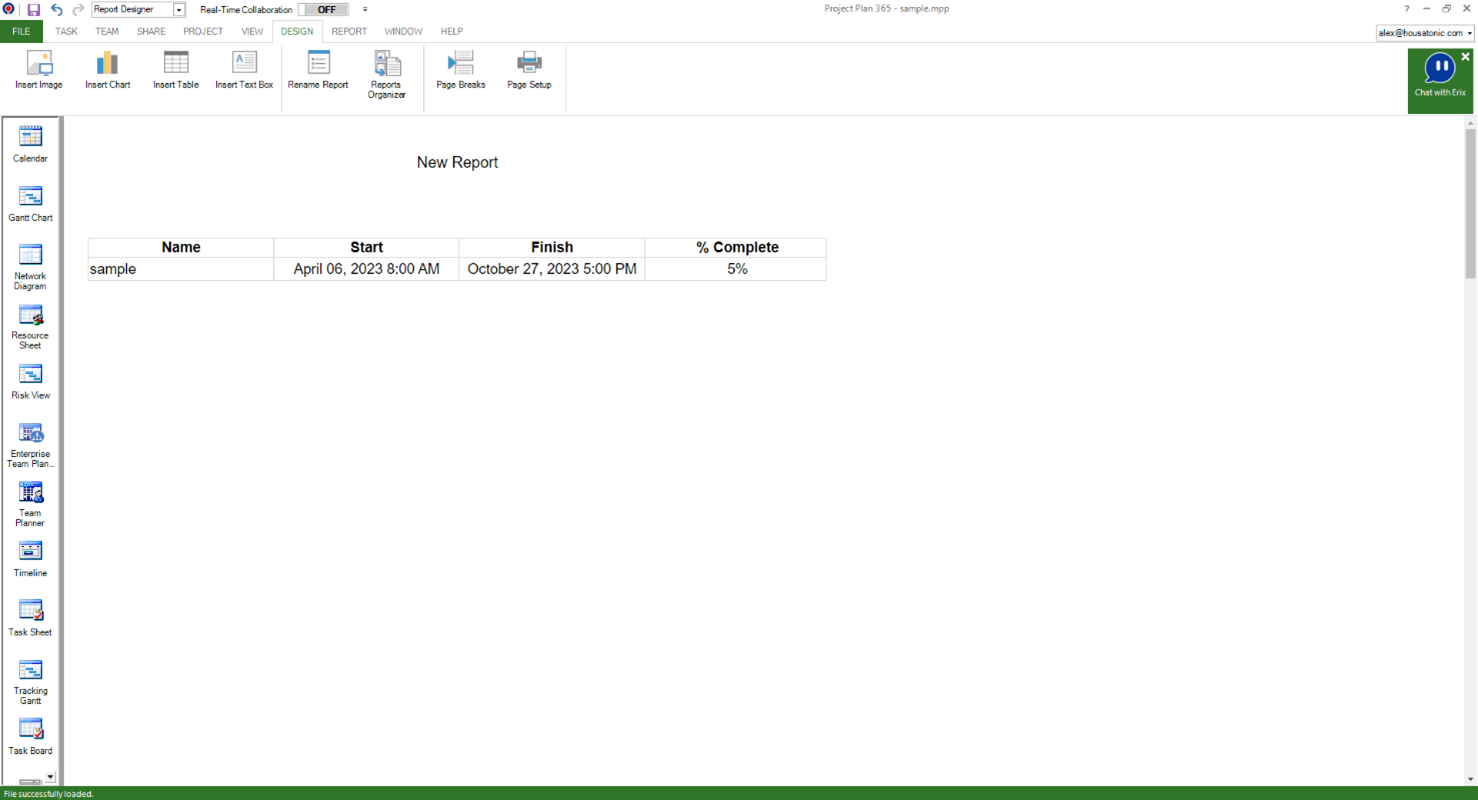
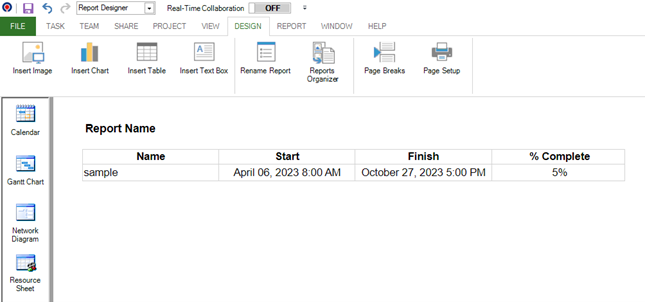
Table – creates a table with Name, Start, Finish, and % Complete fields by default. Allows you to create a report that displays data in a table format. You can choose which data to display and how to format it.
Note: Any of the elements you create from scratch are fully customizable. You can add and delete elements and change the data to meet your needs.
How to open an existing visual report?
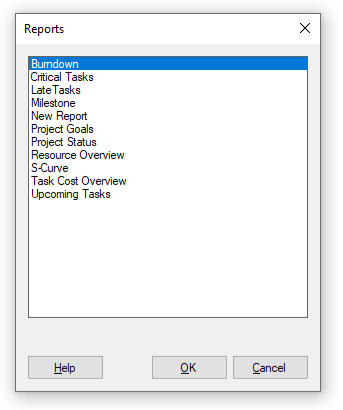
To open an existing visual report, go to menu Report – Visual Reports – select one of the predefined visual reports and click OK.
Note: Any of the elements in the Design page are fully customizable. You can add and delete elements and change the data to meet your needs.
Are there any predefined visual reports?
You can use the following predefined Visual Reports:
Project Status | displays the overall status of the project, including the percentage complete, duration, and cost. |
Upcoming Tasks | displays tasks that are scheduled to start in the next week or two. |
Critical Tasks | displays tasks that are critical to the project's success. |
Late Tasks | displays tasks that are overdue. |
Task Cost Overview | displays the total cost of tasks in the project, broken down by resource and task |
Milestone | displays project milestones and their associated tasks. |
Resource Overview | displays resource assignments and their workloads. |
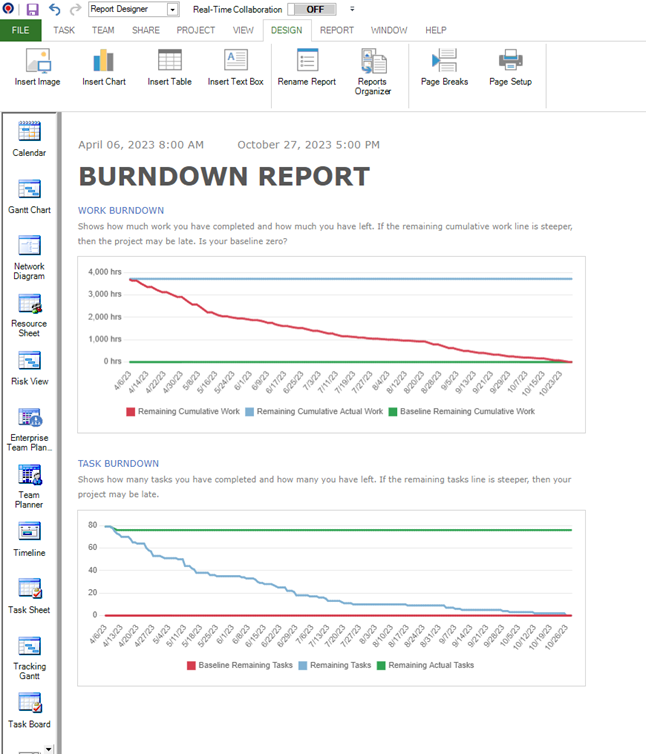
Burndown Report | displays the progress of tasks over time |
S-Curve Report | displays the progress of costs or work over time |
Project Goals | displays the project goals and objectives |
Note: Each report is customizable, so you can choose the data you want to display and the format in which you want to display it. You can also create custom reports from scratch.
How to change data in a visual report?
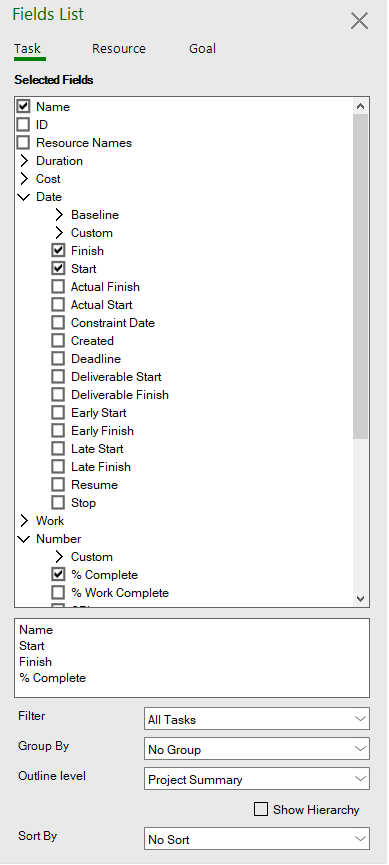
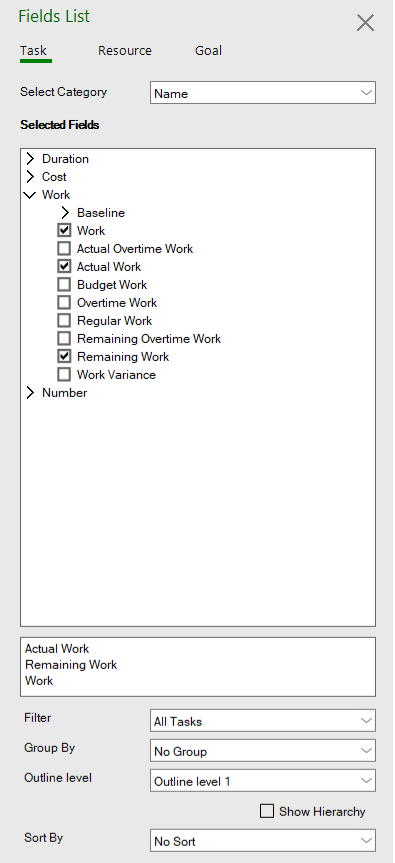
To change the data in a visual report, first go to menu Report – Visual Reports – select the desired report and click OK. In the Design page, click on the table or chart you want to change. Use the Fields List pane on the right of the screen to select the criteria type, fields category, select the fields that appear in the chart/table, apply filters, group the data, select the outline level and sort data.
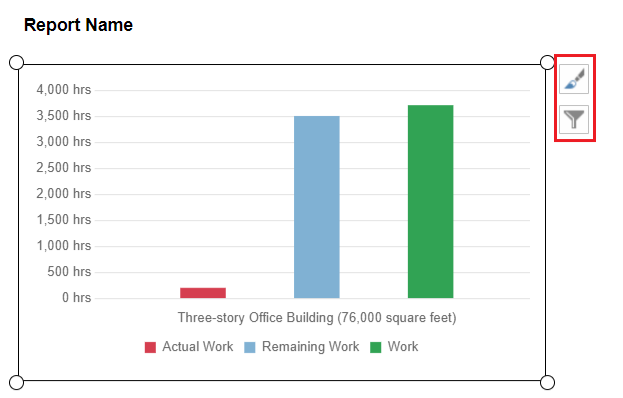
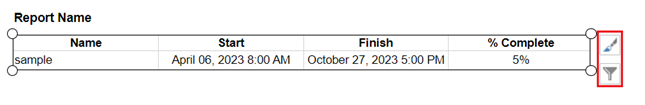
Tip: When you click on a chart/table, two buttons will become available to the right of the chart. Use the Customization ![]() button to customize the border and Filters
button to customize the border and Filters ![]() button to open the Fields List panel to filter the information that goes into the chart/table.
button to open the Fields List panel to filter the information that goes into the chart/table.
How to add a text box in a visual report?
To add a text box in a visual report, go to menu Report - Visual Reports – select the desired report and click OK or go to Report – New Report – Blank/Chart/Table. In the Design menu click on the Insert Text Box button.
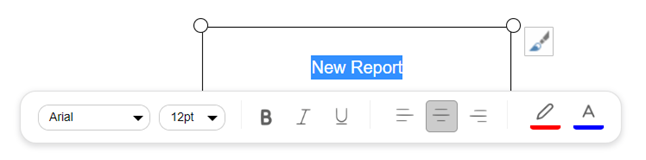
Tip: To format the text, select the desired text and an edit panel will appear where you can change the font, size, font style, alignment, background color and text color.
How to add an image in a visual report?
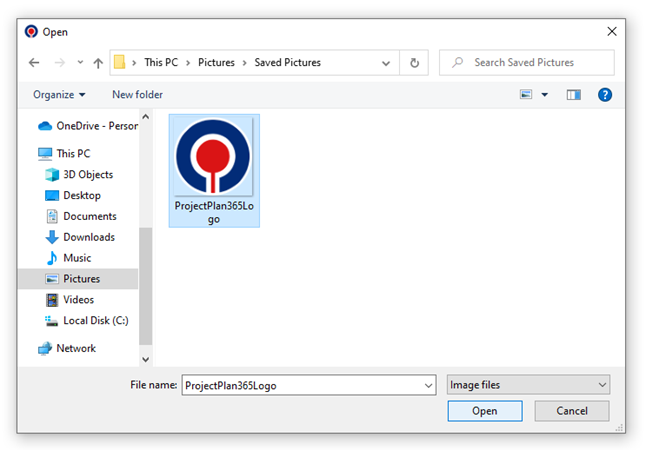
To add an image in a visual report, go to menu Report - Visual Reports – select the desired report and click OK or go to Report – New Report – Blank/Chart/Table. In the Design menu click on the Insert Image button. Select the desired image and click Open.
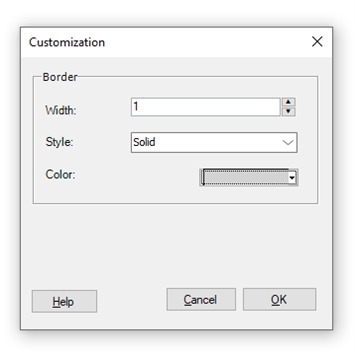
Tip: To format the image border, click on the Customization ![]() button to change the width, style and color of the border.
button to change the width, style and color of the border.
How to add a chart in a visual report?
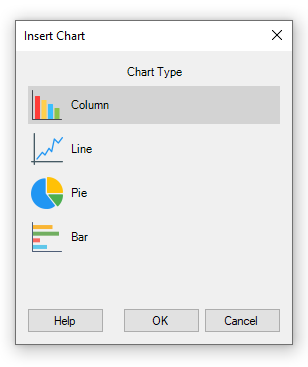
To add a chart in a visual report, go to menu Report - Visual Reports – select the desired report and click OK or go to Report – New Report – Blank/Chart/Table. In the Design menu click on the Insert Chart button. Select the desired chart type and click OK.
Tip: When you click on a chart, two buttons will become available to the right of the chart. Use the Customization ![]() button to customize the border and Filters
button to customize the border and Filters ![]() button to open the Fields List panel to filter the information that goes into the chart.
button to open the Fields List panel to filter the information that goes into the chart.
How to add a table in a visual report?
To add a table in a visual report, go to menu Report - Visual Reports – select the desired report and click OK or go to Report – New Report – Blank/Chart/Table. In the Design menu click on the Insert Table button.
Tip: When you click on a table, two buttons will become available to the right of the chart. Use the Customization ![]() button to customize the border and Filters
button to customize the border and Filters ![]() button to open the Fields List panel to filter the information that goes into the table.
button to open the Fields List panel to filter the information that goes into the table.
How to rename a visual report?
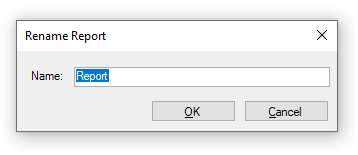
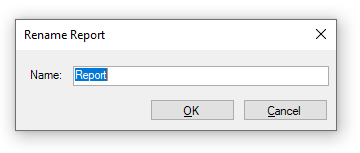
To rename a visual report, go to menu Report - Visual Reports – select the desired report and click OK. In the Design menu click on the Rename Report button. Type in a new name and click OK.
Note: You can also rename a visual report by clicking on the Report Organizer button from Design menu - select the desired report from the Current Project section – click on Rename button – type in a new name and click OK.
How to delete a new visual report?
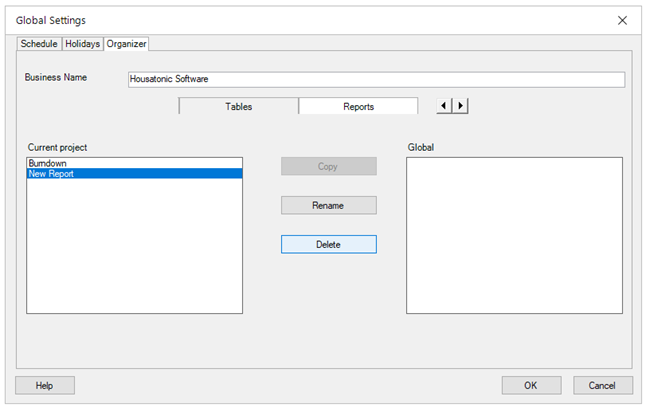
To delete a new visual report, go to menu File – Account – Organization Information – Global Settings – Organizer tab – Reports tab. Select the desired report from the Current Project section and click on Delete button then click OK.
Note: You can also delete a visual report directly from the Report Designer View by going to menu Design – Report Organizer – select the desired report from the Current Project section and click on Delete button then click OK.
How to show page breaks in visual reports design page?
To show the page breaks in visual reports design page, go to menu Report - Visual Reports – select the desired report and click OK. In the Design menu click on the Page Breaks button.
How to print a visual report?
To print a visual report, go to menu Report - Visual Reports – select the desired report and click OK or go to Report – New Report – Blank/Chart/Table. Add or change the desired elements then in the Design menu click on Page Setup button. Set the desired print options then click on Print… button then click on OK button.
Note: You can also print the visual reports by going to menu File – Print.
How to create a chart/table for tasks in a visual report?
To create a chart/table for tasks in a visual report, go to menu Report - Visual Reports – select the desired report and click OK or go to Report – New Report – Blank/Chart/Table. Click on Insert Chart/Insert Table button or click on the desired chart/table and from the Fields List pane click on the Tasks tab to edit the data for tasks.
How to create a chart/table for resources in a visual report?
To create a chart/table for resources in a visual report, go to menu Report - Visual Reports – select the desired report and click OK or go to Report – New Report – Blank/Chart/Table. Click on Insert Chart/Insert Table button or click on the desired chart/table and from the Fields List pane click on the Resource tab to edit the data for resources.
How to create a chart/table for goals in a visual report?
To create a chart/table for goals in a visual report, go to menu Report - Visual Reports – select the desired report and click OK or go to Report – New Report – Blank/Chart/Table. Click on Insert Chart/Insert Table button or click on the desired chart/table and from the Fields List pane click on the Goal tab to edit the data for goals.
How to Export to Image a visual report?
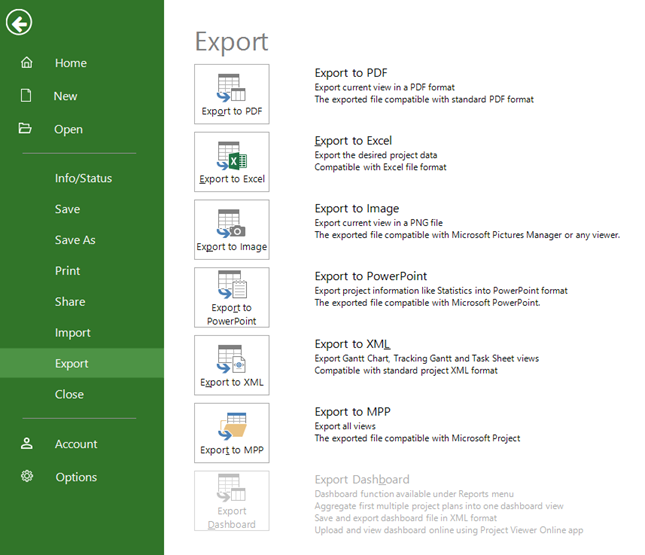
To Export to Image a visual report, first open the desired report by going to menu go to menu Report - Visual Reports – select the desired report and click OK. While in the Report Designer view, go to menu File – Export – Export to Image.
How to Export to PDF a visual report?
To Export to PDF a visual report, first open the desired report by going to menu go to menu Report - Visual Reports – select the desired report and click OK. While in the Report Designer view, go to menu File – Export – Export to PDF.
How can I change the order of the fields displayed in a chart?
To change the order of the fields displayed in a chart, first open the desired report by going to menu go to menu Report - Visual Reports – select the desired report and click OK. Click on the desired chart to open the Fields List panel. In the second box with the selected fields, either drag-and-drop the desired field name up or down or right click on a field name and click Move up/Move down buttons to change the fields order.
How can I change the order of the fields displayed in a table?
To change the order of the fields displayed in a chart, first open the desired report by going to menu go to menu Report - Visual Reports – select the desired report and click OK. Click on the desired table to open the Fields List panel. In the second box with the selected fields, either drag-and-drop the desired field name up or down or right click on a field name and click Move up/Move down buttons to change the fields order.
How can I Zoom In in a visual report?
To Zoom In in a Visual Report, hold the CTRL key and scroll up using your mouse scroll or hold the CTRL key and press the “+” button on keyboard.
How can I Zoom Out in a visual report?
To Zoom Out in a Visual Report, hold the CTRL key and scroll down using your mouse scroll or hold the CTRL key and press the “-” button on keyboard.
How can I disable header row in a table from a visual report?
To disable header row in a table from a visual report, first open the desired report by going to menu go to menu Report - Visual Reports – select the desired report and click OK. Click on the desired table and click on the Customization ![]() button. Uncheck the Show Header Row check box and click OK.
button. Uncheck the Show Header Row check box and click OK.
How to copy/paste an element in a visual report?
To copy/paste an element in a visual report, right click on any element and select Copy. Right-click anywhere outside the element and click Paste.
How to delete an element from a visual report?
To delete an element from a visual report, either right-click on an element and select Delete or select an element and press the Delete key on keyboard.
What subscription do I need to have to use the Visual Reports feature?
The Visual Reports feature is available only with a Business Subscription.
How to maintain the ratio when resizing an image in a visual report?
To maintain the ratio when resizing and image in a visual report, hold the SHIFT key and resize the image by drag-and-dropping one of the border corners.
How to see guide lines when aligning elements in a visual report?
To see guide lines when aligning elements in a visual report, hold the CTRL key pressed and move elements in the page, you will see blue dashed lines that will guide how to align elements vertically, horizontally, or both.
On what platform is the Visual Reports functionality available?
The Visual Reports functionality is currently available only on the Windows and Mac platforms.
Can I use the created Visual Reports in all organization projects?
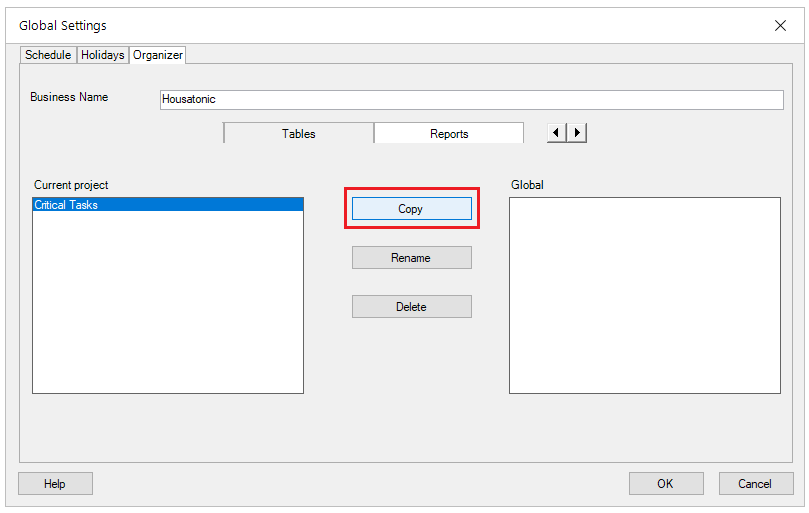
To use the created Visual Reports in all organization projects you need to copy them in Global Settings by opening the desired report from menu Report - Visual Reports - in the Design menu click on Report Organizer - Reports tab - select the desired report from the Current list and click the Copy button to copy it to the Global list. Click OK to save the changes.
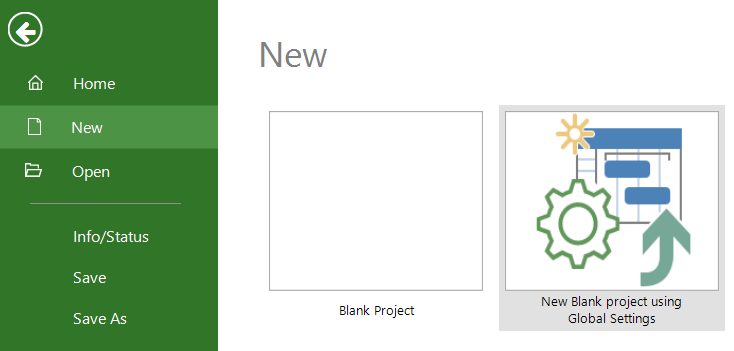
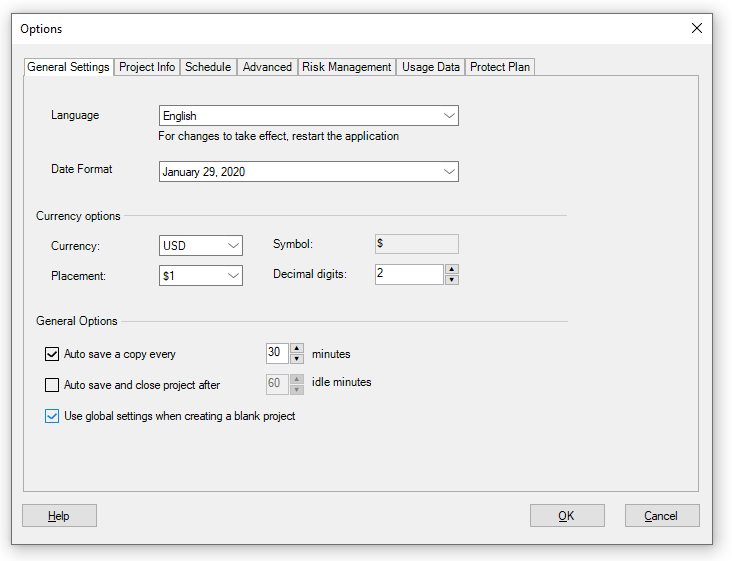
Note: In order for the copied visual reports to appear in all organization projects, use the New Project using Global Settings option from the File - New menu or go to menu File - Options and check the "Use global settings when creating a blank project option".
Step by step on how to create a new visual report:
1. Open the desired project and go to menu Report – New Report.
2. Select the desired report from the list and click OK.
Blank – creates a blank canvas. Allows you to create a report from scratch, adding text boxes, images, and other elements as needed. This is a good option if you want complete control over the design of your report.
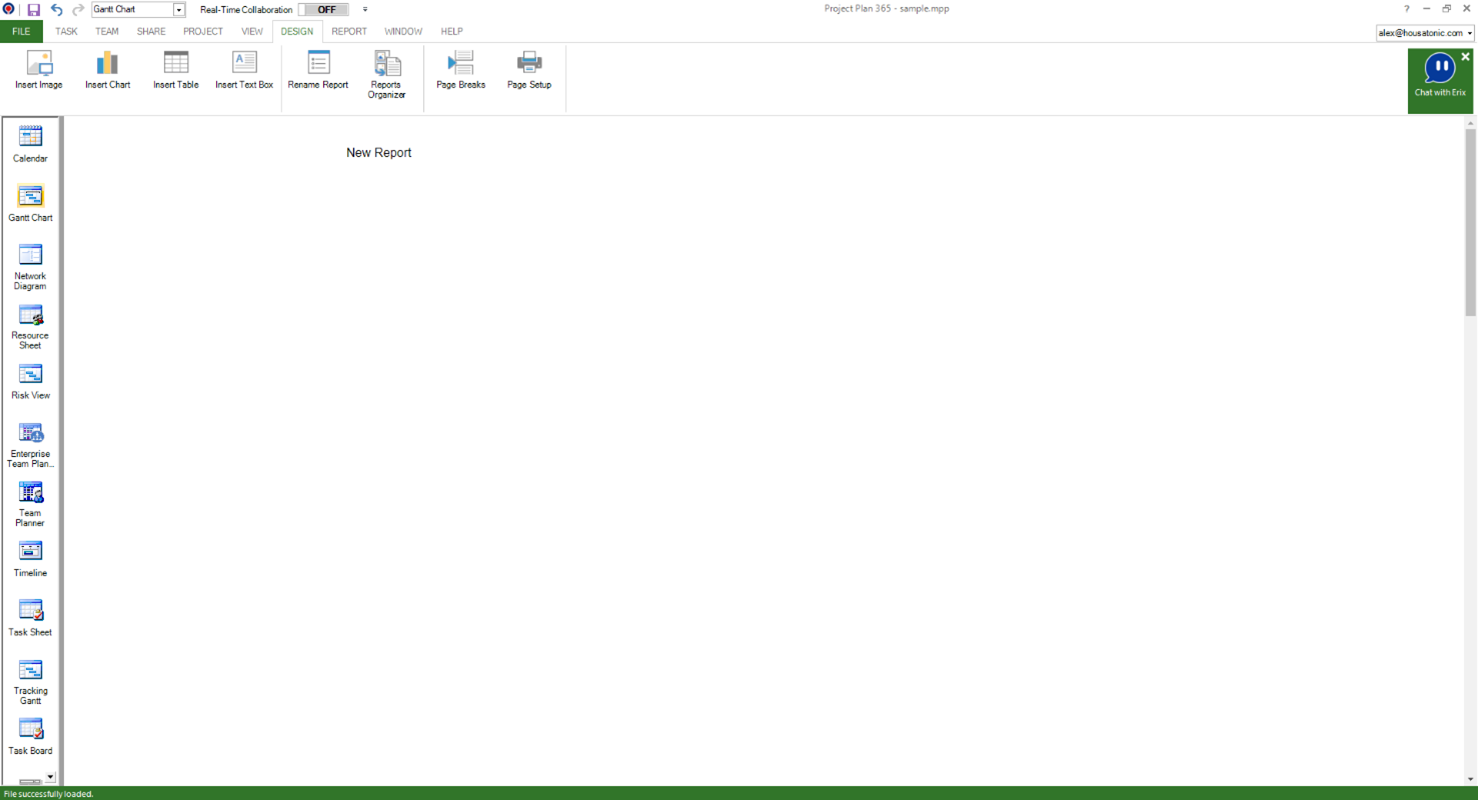
Chart – creates a chart comparing Actual Work, Remaining Work, and Work by default. Allows you to create a report that displays data in a chart or graph format. You can choose from several chart types, such as bar charts, pie charts, and line graphs.
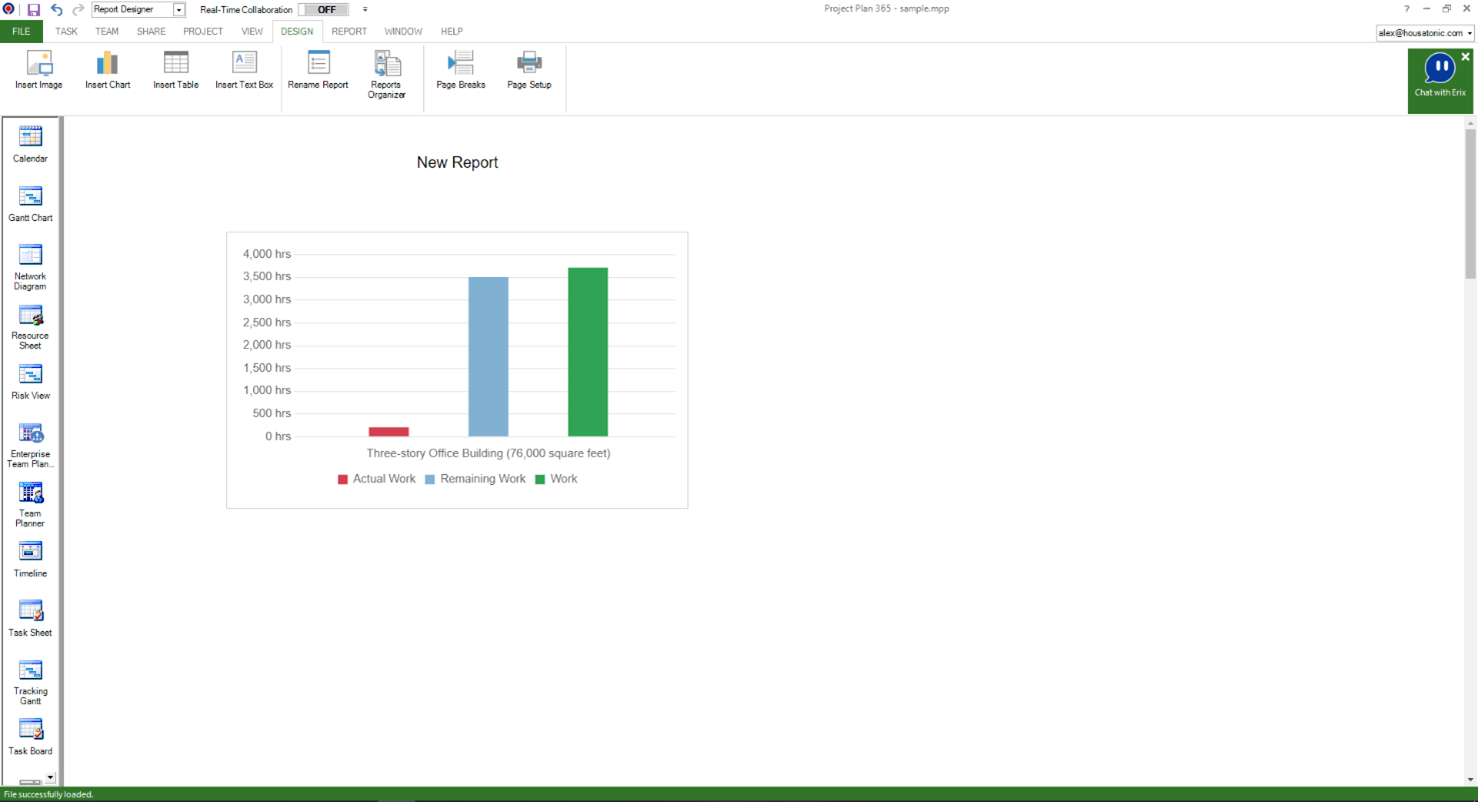
Table – creates a table with Name, Start, Finish, and % Complete fields by default. Allows you to create a report that displays data in a table format. You can choose which data to display and how to format it.
3. Type in a name and click OK.
4. In the new Design page, add the desired elements by using the available tools.
5. Format the text by selecting it to open Format Control.
6. Change the data for charts and tables by clicking on them to open Fields List panel.
7. Resize and move elements as desired.
Tip: Click on the Page Break button from the Design menu to see the page borders.
Step by step on how to open an existing Visual Report:
1. Open the desired project and go to menu Report – Visual Report.
2. Select the desired report from the list and click OK.
3. The report will be opened in a new Report Designer view.
Note: Any of the elements in the Design page are fully customizable. You can add and delete elements and change the data to meet your needs.
Step by step on how to insert a text box in a visual report:
1. Go to menu Report - Visual Reports – select the desired report and click OK or go to Report – New Report – Blank/Chart/Table.
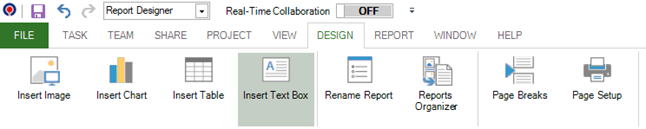
2. In the Design menu click on the Insert Text Box button.
Tip: To format the text, select the desired text and a Format Control will appear where you can change the font, size, font style, alignment, background color and text color.
Tip: To format the image border, click on the Customization ![]() button to change the width, style and color of the border.
button to change the width, style and color of the border.
Step by step on how to add a chart in a visual report:
1. Go to menu Report - Visual Reports – select the desired report and click OK or go to Report – New Report – Blank/Chart/Table.
2. In the Design menu click on the Insert Chart button.
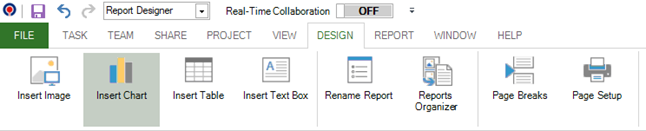
3. Select the desired chart type and click OK.
4. The chart will be inserted in the Report Designer with the default fields.
5. Click on the chart to open the Fields List panel where you can select the criteria type, fields category, which fields to be shown in the chart, rearrange the fields order, apply filters, group by, select outline level and sort.
6. Move and resize the chart as desired.
Tip: When you click on a chart, two buttons will become available to the right of the chart. Use the Customization ![]() button to customize the border and
button to customize the border and ![]() Filters button to quickly open the Fields List panel to filter the information that goes into the chart.
Filters button to quickly open the Fields List panel to filter the information that goes into the chart.
Step by step on how to add a table in a visual report:
1. Go to menu Report - Visual Reports – select the desired report and click OK or go to Report – New Report – Blank/Chart/Table.
2. In the Design menu click on the Insert Table button.
3. The table will be inserted in the Report Designer with the default fields.
3. The table will be inserted in the Report Designer with the default fields.
4. Click on the table to open the Fields List panel where you can select the criteria type, fields category, which fields to be shown in the table, rearrange the fields order, apply filters, group by, select outline level and sort.
6. Move and resize the table as desired.
Tip: When you click on a table, two buttons will become available to the right of the chart. Use the Customization ![]() button to customize the border and
button to customize the border and ![]() Filters button to quickly open the Fields List panel to filter the information that goes into the table.
Filters button to quickly open the Fields List panel to filter the information that goes into the table.
Step by step on how to add an image in a visual report:
1. Go to menu Report - Visual Reports – select the desired report and click OK or go to Report – New Report – Blank/Chart/Table.
2. In the Design menu click on the Insert Image button.
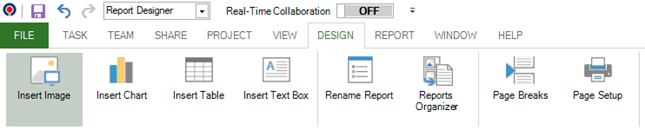
3. Select the desired image and click Open.
4. Move and resize the image as desired.
Tip: To format the image border, click on the Customization ![]() button to change the width, style and color of the border.
button to change the width, style and color of the border.
Step by step on how to rename a visual report:
1. Go to menu Report - Visual Reports – select the desired report and click OK or go to Report – New Report – Blank/Chart/Table.
2. In the Design menu click on the Rename Report button.
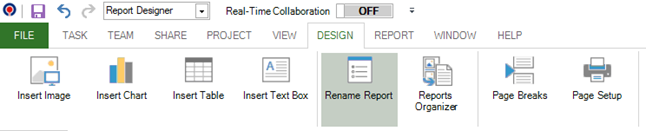
3. Type in a new name and click OK.
Step by step on how to export a visual report:
1. Open the desired report by going to menu Report – Visual Report – select a report and click OK.
2. Go to menu File – Export – Export to PDF/Export to Image.
3. The report will be exported in the desired format.
Step by step on how to delete a new visual report:
1. Open the desired report by going to menu Report – Visual Report – select a report and click OK.
2. In the Design menu click on Report Organizer button.
3. In the Global Settings dialog, in the Current Project section select the desired report and click Delete.
Step by step on how to use the created Visual Reports in all organization projects:
1. Open the desired report by going to menu Report – Visual Report – select a report and click OK.
2. In the Design menu click on Report Organizer button.
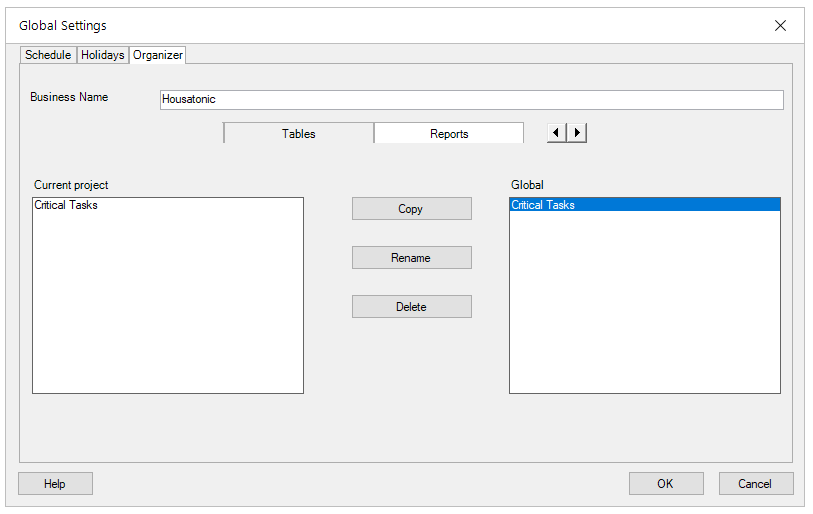
3. In the Global Settings dialog, in the Current Project section select the desired report and click Copy.
4. The report will be copied to the Global list. Click OK to save the changes.
Note: In order for the copied visual reports to appear in all organization projects, use the New Project using Global Settings option from the File - New menu or go to menu File - Options and check the "Use global settings when creating a blank project option".