
A crosstab is a report that shows the tasks that resources are assigned to and work information. Who Does What When report displays information about tasks and resources over a specified time period. You can show a list of tasks with their assigned resources at the left of report with a timescale across the top. At the intersection of a task row and a time column, you can see cost information for the task within that time period.
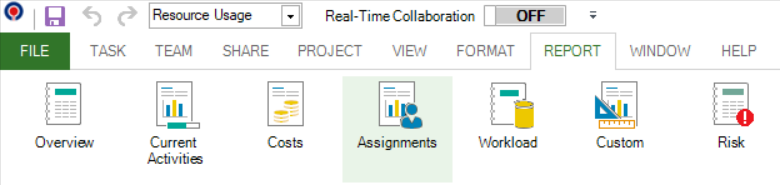
Who Does What When report is available from Report menu → Assignments.
Who Does What When report can be viewed, printed and exported in formats such: PDF and image (.png).
 Practice
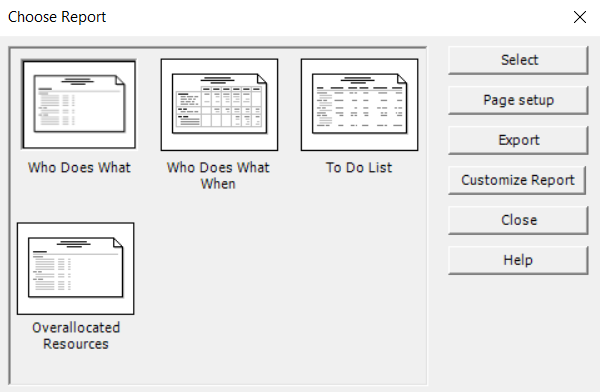
1. Use the Commercial Construction project plan created during Lab 8 - Entering Progress. In Gantt Chart view apply Who Does What When report from the Assignments category. To apply a report, go to Report menu and from there select the desired report category, and then choose from the available reports. You should see the following:
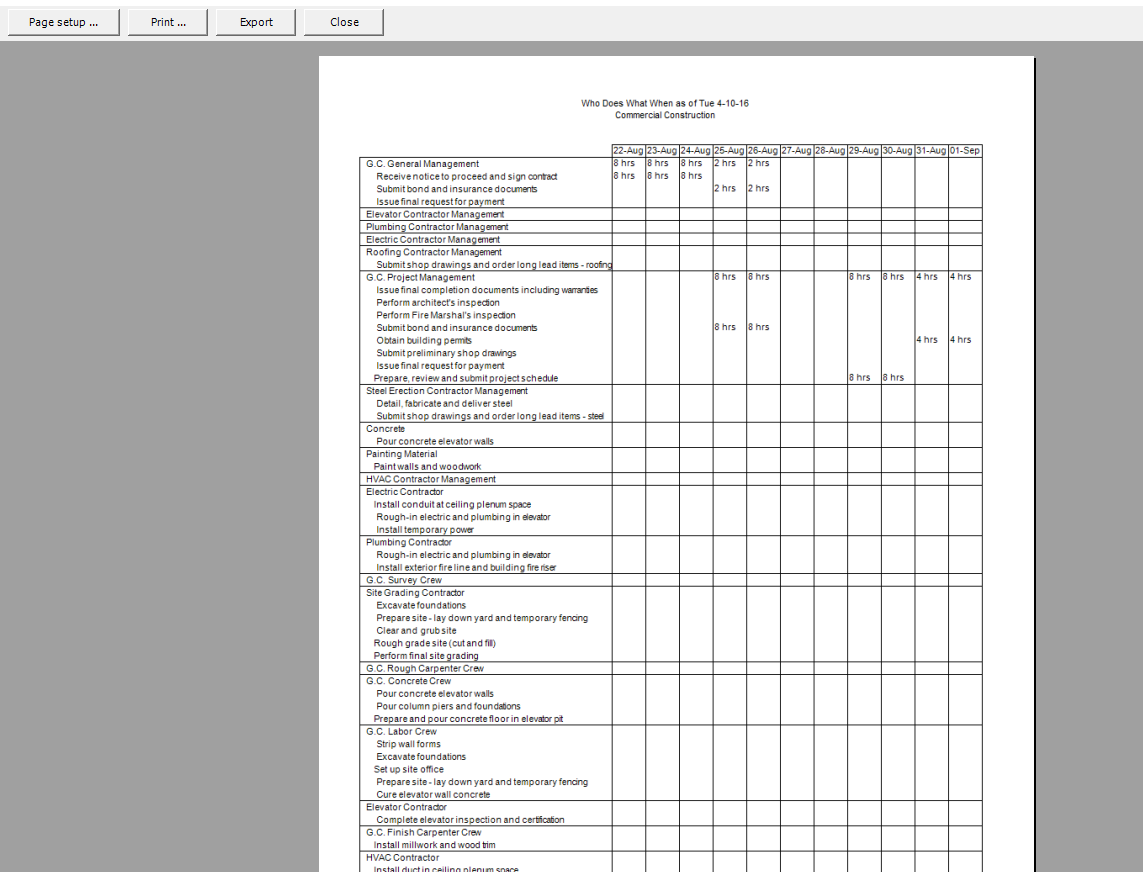
2. In the previous displayed Print Preview dialog, press the Export button and select PDF as format. Choose the location on disk where the exported PDF file to be saved. Locate and open the report in PDF format.
 Video
Video
If you prefer to see things in action, rather than reading text, watch out this video, which covers some of the topics from this section.