
Gantt bars look simple enough, but they can get confusing as projects get complex. Customizing the bars on a Gantt Chart view is often the first thing a project manager does to create clarity in a project and to help spot problem areas quickly. Formatting the look and feel of the Gantt bar area is very useful. You can choose to format one bar at a time or make view-wide changes to your Gantt bars. In terms of view-wide changes, you can modify the look and feel of summary tasks, tasks, and milestones, including attributes such as progress lines for percent complete, delay lines, and so on.
To better highlight certain tasks or phases during the execution of your project, Project Plan 365 gives you the possibility to change the default bar format of your tasks in the Gantt Chart. The Bar Styles option allows you to customize the appearance of the bars from Gantt Chart view. You can highlight categories of tasks, or you may want to format a Gantt Chart view to quickly identify specific tasks.
By using the Bar Styles option you can modify the look & feel of the bars of different task types such as: regular tasks, summary tasks and milestones. Not only you can change the appearance of the bar, but you can also add text around the bar. Any of the fields available to be added to a table is also available to be added on top of, below, to the right of, to the left of, or inside a bar, such as to better fit your visualizing needs. This allows for richer communication of schedules.
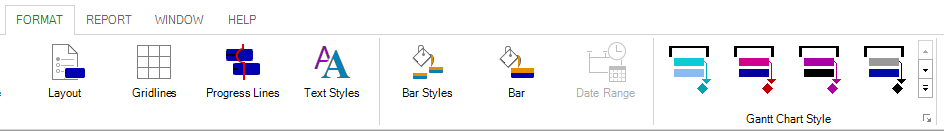
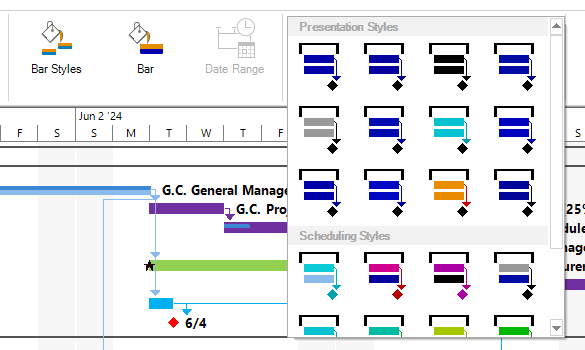
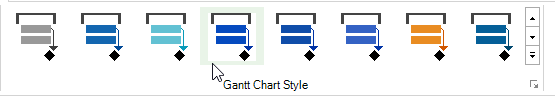
Another useful option that allows you to quickly change the appearance of bars in the right side of Gantt Chart is Gantt Chart Style, available in the Format menu. Using this option you can easily change the Gantt bars quickly by choosing among some predefined styles.
Step by step on how to change color, shape or pattern of Gantt bars:
To call attention to task bars on a Gantt Chart view, such as a milestone or summary task, you can change their color, shape, or pattern to separate them from other bars of a particular type.
- Apply a Gantt Chart view (such as Gantt Chart, Tracking Gantt).

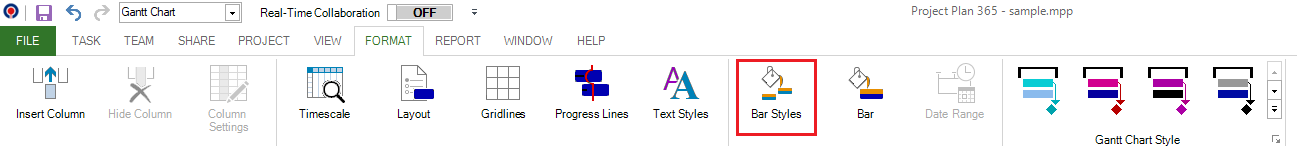
- Double-click anywhere in the chart portion of a Gantt Chart view (but not individual bars), or in the Gantt Chart View (or other) - select Format menu– click Bar Styles.
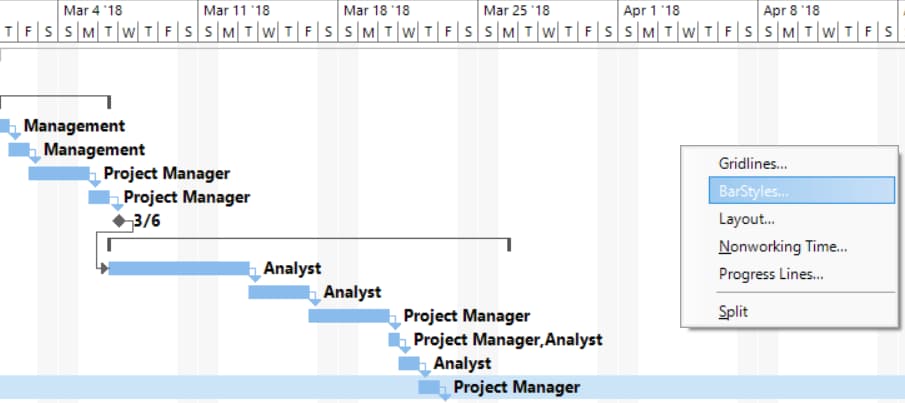
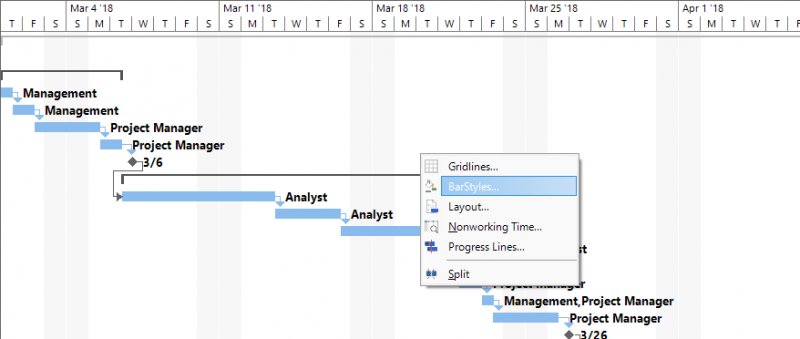
You can also select Bar Styles option from the contextual menu by right-clicking in the chart portion of a Gantt Chart view.
- In the Name field, click the type of Gantt bar (such as Task or Progress) that you want to format, and then click the Bars tab.
- Under Start, Middle, and End, click the shapes, types or patterns, and colors for the bar. For example, if you click Milestone and change the shape and color, the change affects all the milestones in the chart.
Note: Some categories have only a start shape (such as milestone), while other categories have a start shape, middle bar, and end shape (such as summary tasks).
- Preview how the Gantt bar will look like in Sample area.
- Click OK to accept all new bar modifications.
- Click Cancel if you decide not to make the changes.
- Click Reset if you already clicked OK before and you want to undo all the changes made to that specific bar.
Step by step on how to add text to Gantt bars:
You can add specific project information, such as task names, resource names, completion percentages, and start dates, to bars on a Gantt view. In most cases you will want to add text to certain types of Gantt bars.
- Apply a Gantt Chart view (such as Gantt Chart, Tracking Gantt).
- Double-click anywhere in the chart portion of a Gantt Chart view (but not individual bars), or in the Gantt Chart View (or other) - select Format menu– click Bar Styles.
You can also select Bar Styles option from the contextual menu by right-clicking in the chart portion of a Gantt Chart view.
- In the table, click the type of Gantt bar (such as Task or Progress) that you want to add text to, and then click the Text tab.
- In the Left, Right, Top, Bottom, and Inside boxes, type or select the field that contains the data you want to display on the Gantt bar.
Note: If you want to add text that is unique to each task type, type or select a custom text field, such as Text1, Text2, or Text3. Text that you enter into these fields from other views is automatically added to the Gantt bars.
Tip: Do not add too many text items. They can become impossible to read. Use enough text to help readers of the plan identify information.
- Preview how the Gantt bar will look like in Sample area.
- Click OK to accept all new bar modifications.
- Click Cancel if you decide not to make the changes.
- Click Reset if you already clicked OK before and you want to undo all the changes made to that specific bar.
To highlight a single Gantt bar by changing its formatting, double-click on the bar in the right side chart portion of a Gantt view, or you can select the task in the left side grid and click on Bar ![]() option from the Format menu, to display the Format Bar dialog. By using the Bar option, you can change the color, shape, or pattern of an individual Gantt bar, rather than a type of bar, if you want to highlight a specific task in your plan. Therefore, the Bar Styles option allows you to make view-wide changes to all the bars in the Gantt Chart view, whilst by using the Bar option you can apply changes to only a specific bar that you've selected.
option from the Format menu, to display the Format Bar dialog. By using the Bar option, you can change the color, shape, or pattern of an individual Gantt bar, rather than a type of bar, if you want to highlight a specific task in your plan. Therefore, the Bar Styles option allows you to make view-wide changes to all the bars in the Gantt Chart view, whilst by using the Bar option you can apply changes to only a specific bar that you've selected.
 Practice
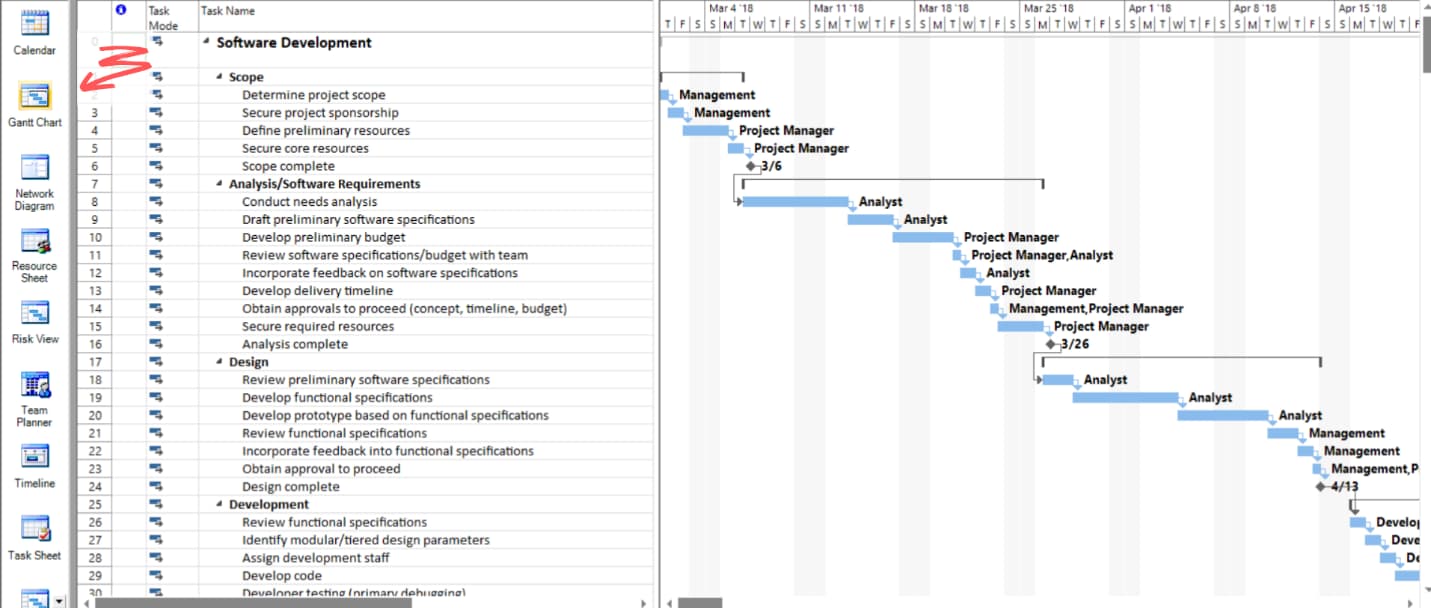
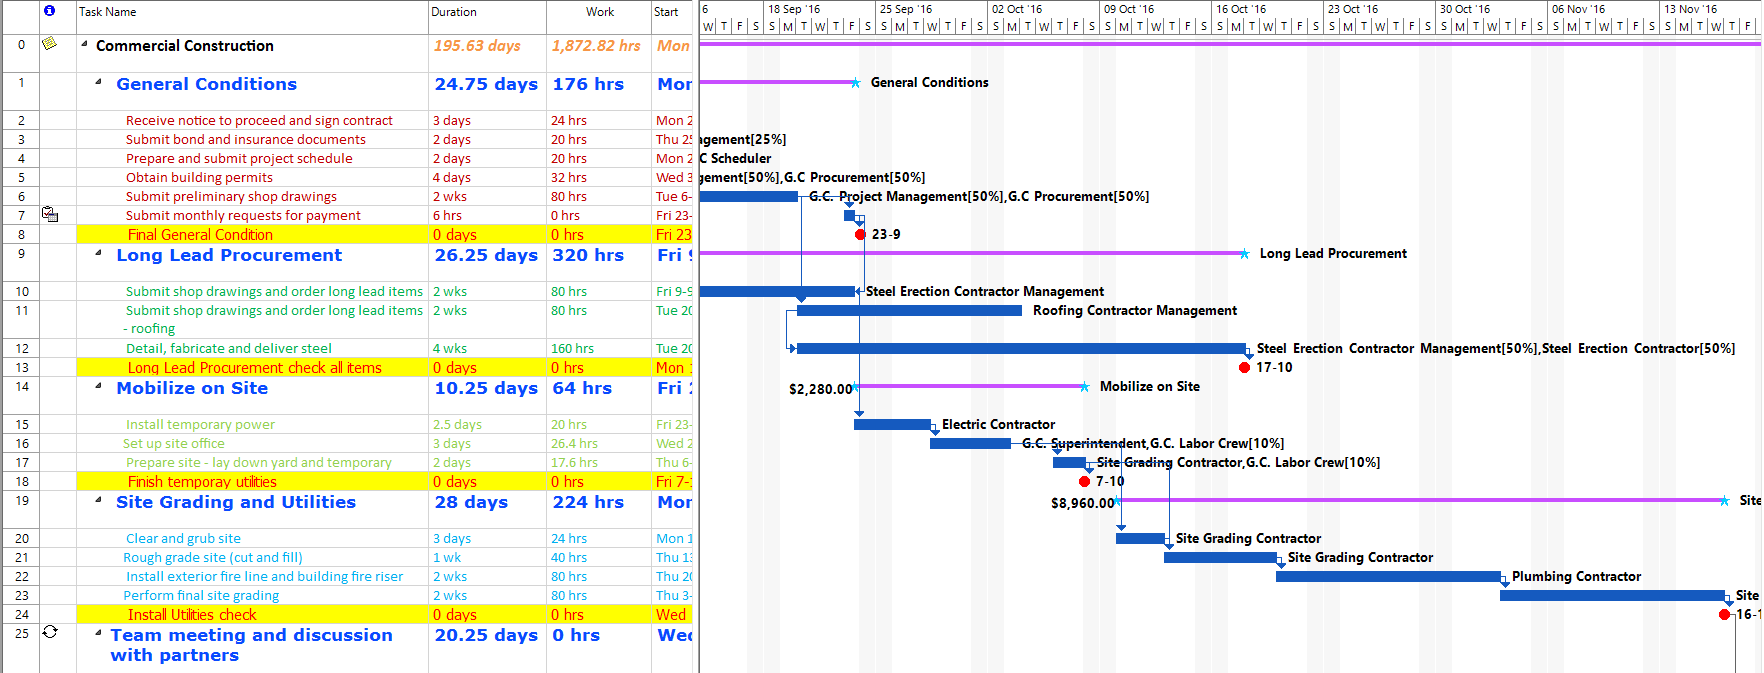
1. In the commercial construction project, let's customize the display of the taskbars from the right panel of Gantt Chart. For formatting the taskbars, we will first use the predefined Gantt Chart Style available in the Format menu as a separate group. In the Bar Styles group you can scroll up and down and you will see a gallery of predefined styles to choose from. Using this option you can easily change the Gantt bars quickly by choosing among some predefined styles.
 Let’s select this one and see what happens.
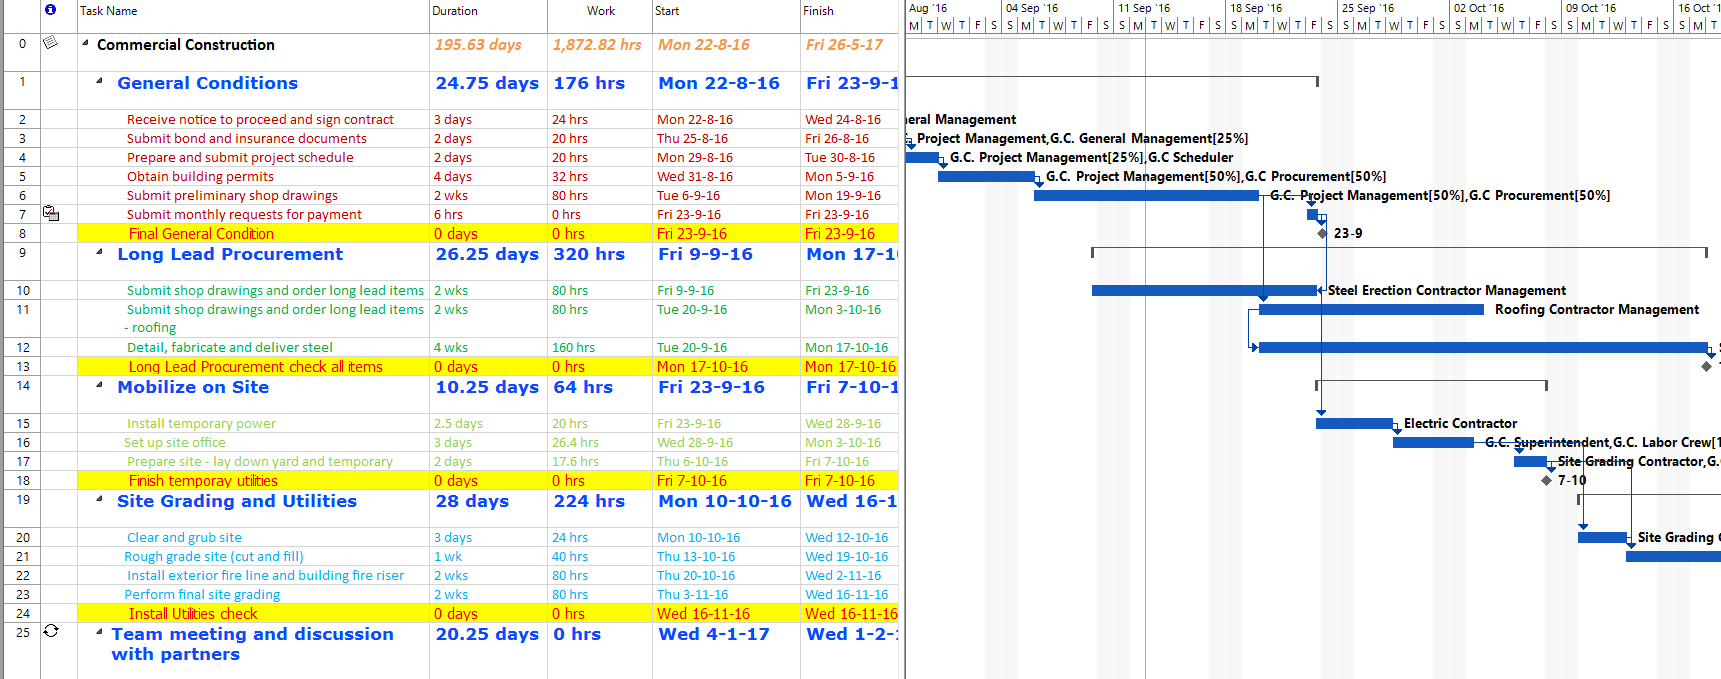
2. Drag the divider to the left to reveal more content from the right side. Notice that in the right panel of Gantt Chart, all the taskbars have changed their color into dark blue, just as indicated by the button within the Gantt Chart Style group. With a single click, a predefined style was applied to all bars in the Gantt Chart view.
3. Now, let’s use the Bar Styles option under Format menu.
Using the Bar Styles option, you can format the style for a whole category of bars, analogous to the Text Styles option that is used to format the text of certain types of tasks.
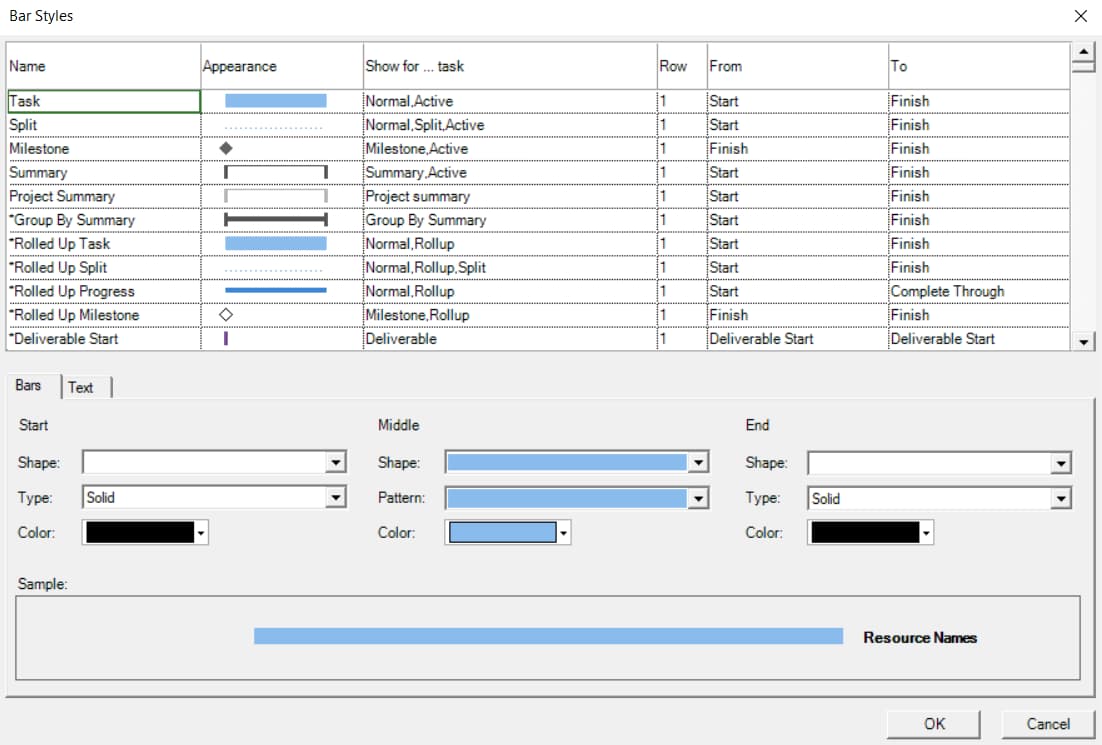
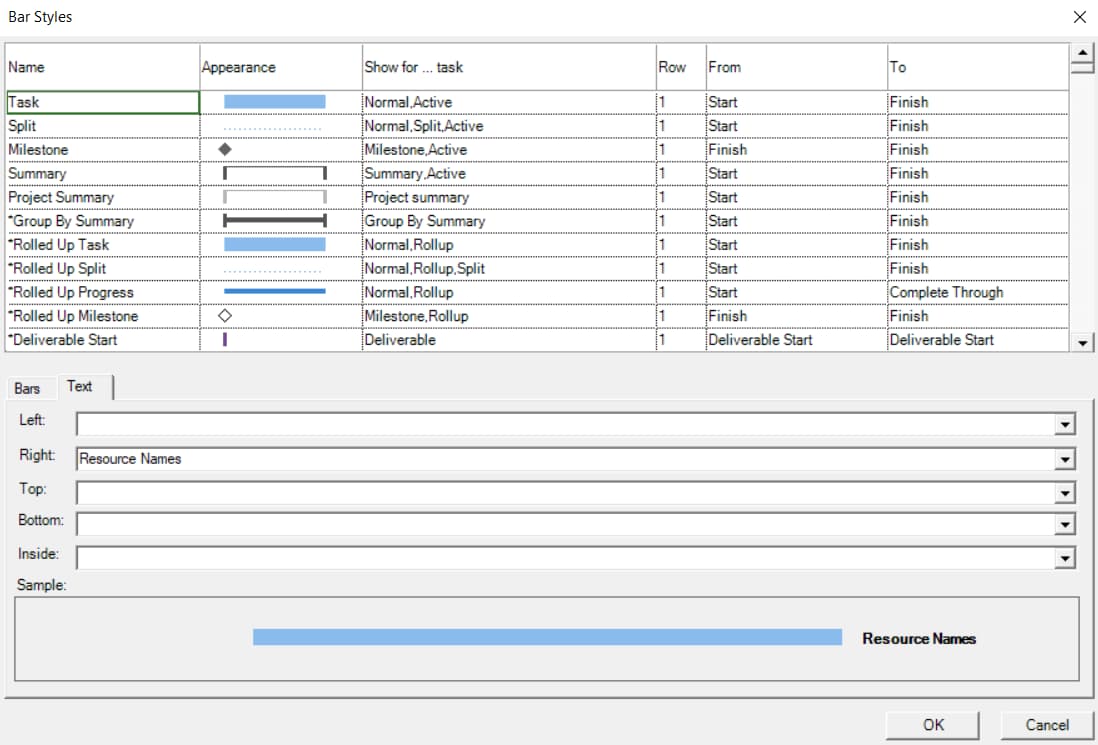
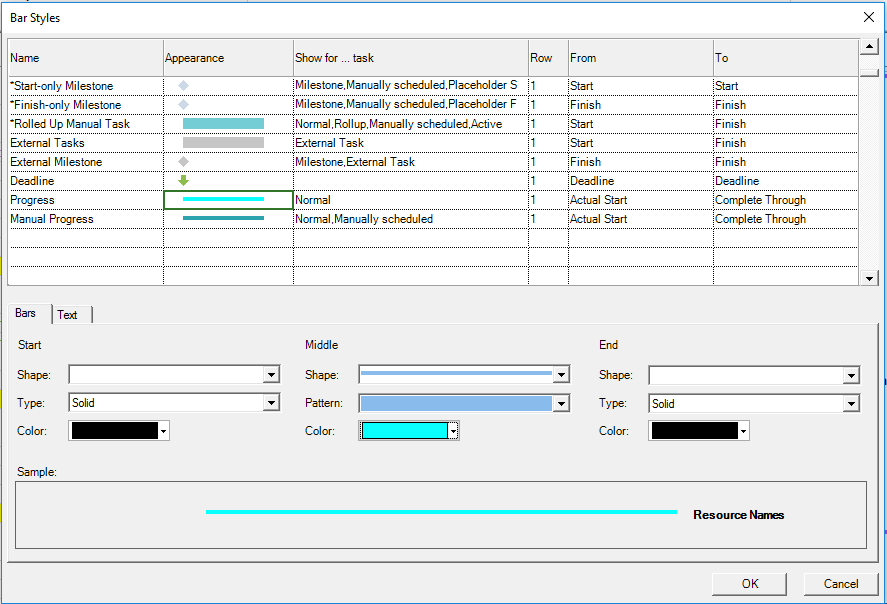
Press on this option and a Bar Styles dialog will be displayed. As you may notice, you will see here listed all the types of bars that you might see in the right side of Gantt Chart such as bars for regular tasks, milestone, summary and project summary tasks.
Using the Bar Styles option you can format a particular type of taskbars, and this style will be applied to all the taskbars of this type, instead of having to go through each individual taskbar and format it. The text in the Show for ... task column specify the type of tasks to which this style should be applied. The Row column tells you to at which row the style to begin being applied. You can then use the From and To column to choose when this style should start and end being applied in your right chart. Also next to each type of bar you may see a preview of its current appearance in the right Gantt Chart.
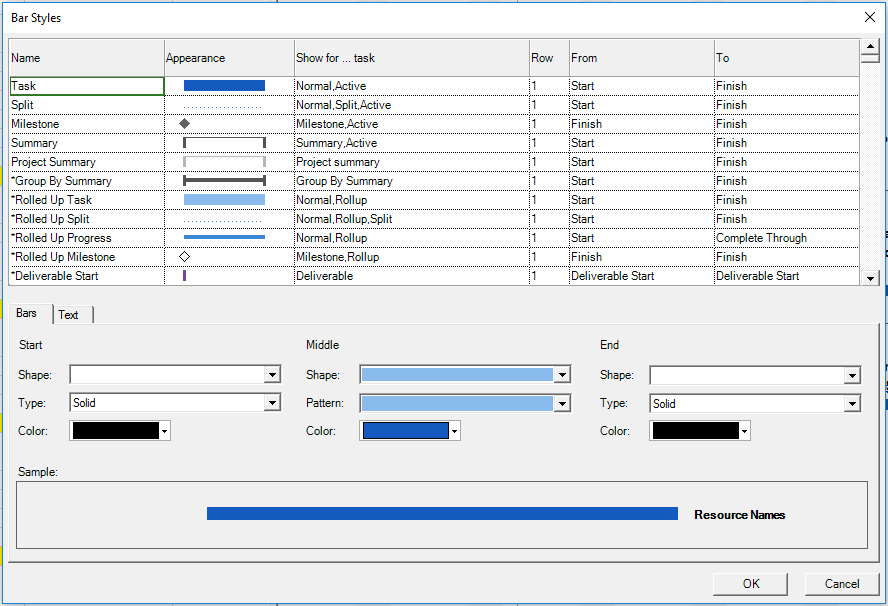
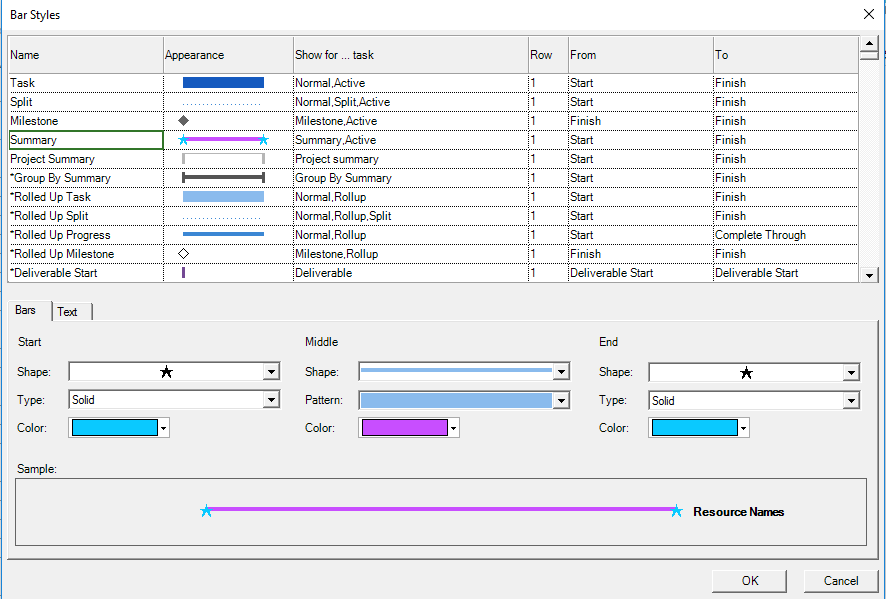
4. Let’s suppose that we want to customize the appearance of the summary taskbars. Select in this list Summary. As you see in the bottom of this dialog, you have two tabbed controls: Bars and Text. In the Bars tab, you can specify how the start, middle and end section of a bar will look like by indicating the shape, type and color. Let’s change how the middle part of the bar will look like: choose violet color and change the shape to a thicker one. For the start section of the bar as shape choose the star and as color blue. And the same for the end part of the bar.
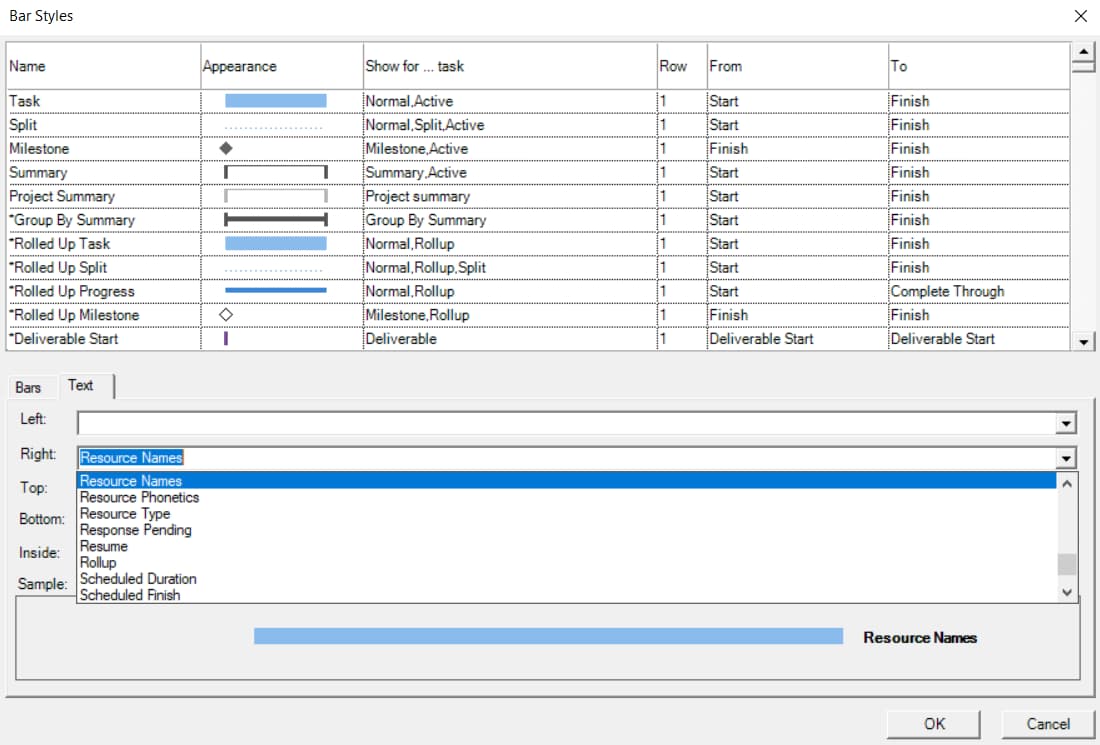
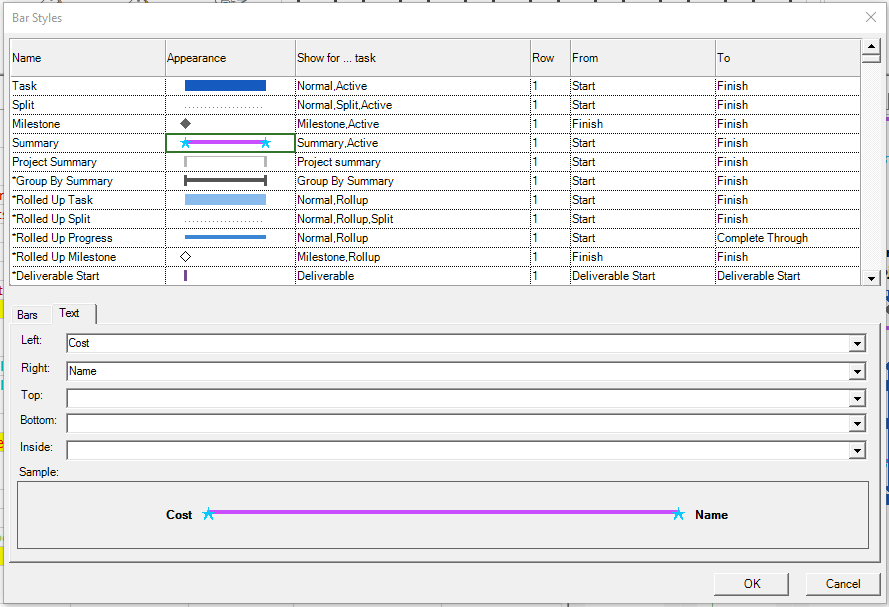
5. Now select the Text tab. Here you can specify at which position (left, right, top, bottom or inside) in relation to the bar to display a certain information. Any of the fields available to be added to a table is also available to be added to the right of, to the left of, or inside a bar. This allows for richer communication of schedules. We will choose to display the cost of the task to the left of the taskbar, such as to be more easily for us to identify the cost for each summary task. For right of the bar we will select Name, to display the name of the task, in order to be more easily for us to identify the task to which the bar corresponds to. In the list select the field Name. Keep in mind that you don’t want to clutter the right side of Gantt Chart with too much information displayed around the taskbars. Notice the Sample area at the bottom that offers you a preview of how the bar will look like.
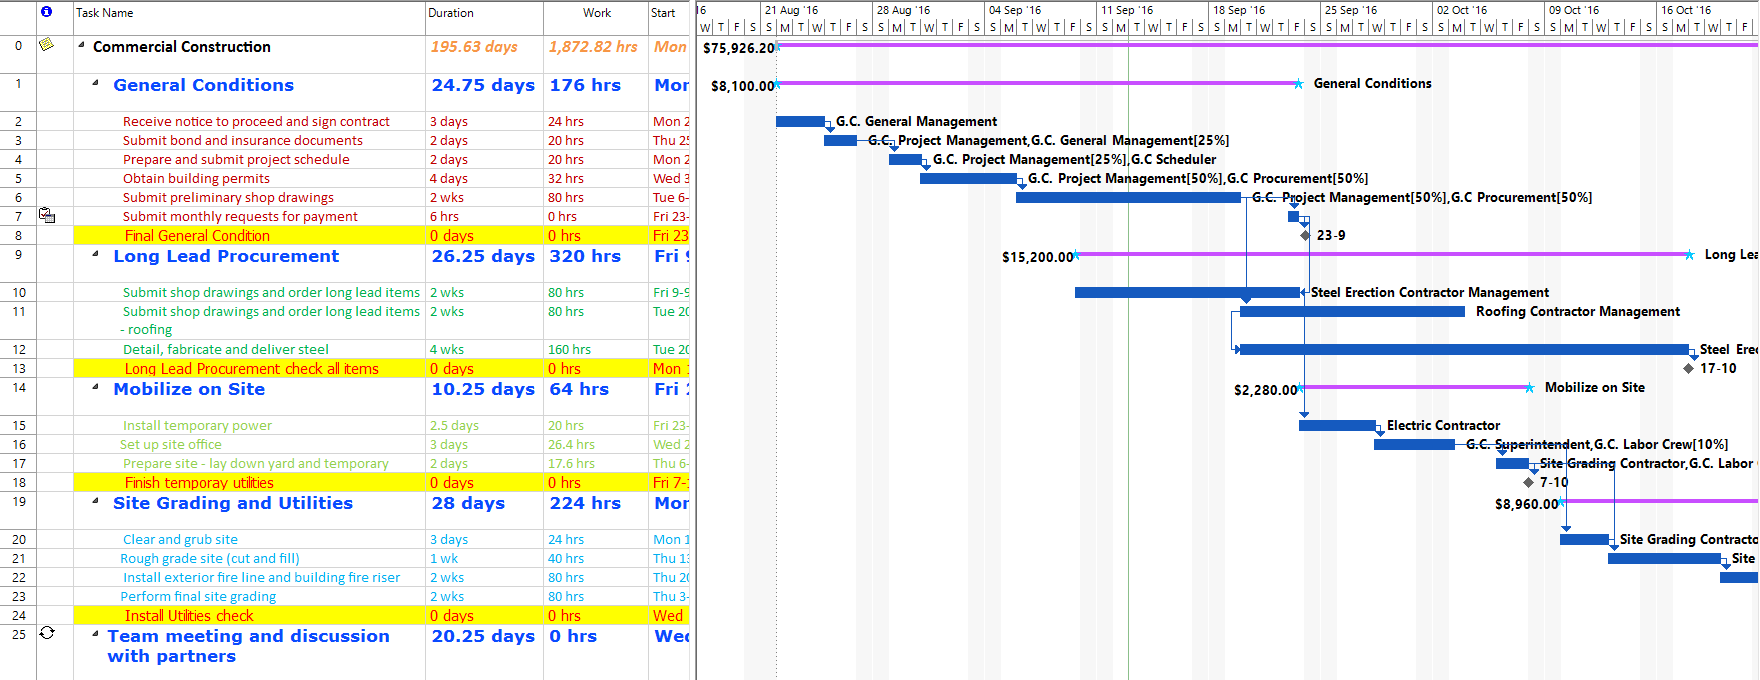
6. Once you’ve finished customizing the bar style for the summary tasks, you can press the OK button to apply it to all of the taskbars of that particular type. As a result, next to each summary taskbar it will be displayed the name of the task in the right and the cost of it in the left. Also you can see that now all of the bars of the summary tasks have a blue star displayed at the start and end sections and a thicker violet bar in the middle.
7. Now let’s suppose that we want to call attention to the bars of milestone tasks in our Gantt Chart. For this we will use the same Bar Styles option. More exactly we will change their shape and their color. In the Name field of the Bar Styles dialog select Milestone and in the Bars tab, choose red color for the start section of the bar. For the shape let’s choose the circle, which you can found it at the end of the drop-down list.
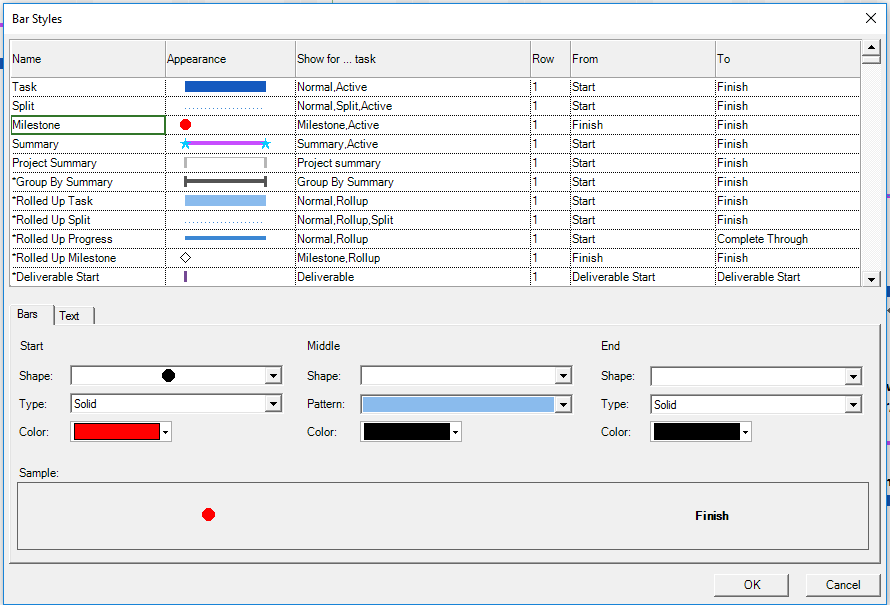
Press OK and you will notice that now all the milestones will be displayed as red circles in the right Gantt panel.
8. Next let’s suppose that we want to format the bars for the progress lines, which indicate the percent complete of a task. These are meant to display the progress a task has as a thin line displayed inside a taskbar. For this, let’s open again the Bar Styles dialog. Move to the end of this list where you’ll find an item called Progress. Select it and for the middle portion of the bar we will choose aqua as color.
Once you’ve done this, you will see no difference in the right Gantt chart, since we haven’t entered yet any progress for our tasks.
 Video
Video
If you prefer to see things in action, rather than reading text, watch out this video, which covers some of the topics from this section.