Lesson 9: Enter Task Percent Complete
HOME <<PREVIOUS NEXT>>
Creating a schedule is only the first step in successfully managing a project. With Project Plan 365, you can also monitor the progress of your project.
Tracking progress has several benefits. You can:
- Identify and solve problems as they occur.
- Produce status reports for management and project participants.
- Maintain historical data to help you plan future projects more accurately.
Once the execution of your project began, your team may actually start to enter their recorded progress on their assigned tasks, so that the project manager can track the current progress of the tasks. In order to do this, each team member should mark at least the tasks that are finished and mark them as complete, by entering in the corresponding cell from % Complete column the value of percent = 100%.
You can indicate how much progress has been made on a task by entering the percentage of the total task duration that is complete. For tasks that are relatively short in duration, it may not be worthwhile to track progress in such detail; but for tasks of an extended duration, indicating the percentage of the task that is complete helps you track actual progress against the baseline plan.
A task is zero percent complete when it has not yet begun, and it is 100 percent complete when it is finished.
Step by step on how to indicate progress on a task as a percentage
- In the Gantt table, select the task for which you want to update progress.
- Open the Task Information window.
Or enter the progress of tasks using the mouse. - In the Percent Complete box, type a whole number between 0 and 100.
- Choose the OK button.
By default, Project Plan 365 indicates the percentage of the task that is complete on the Gantt bar chart as a thin line drawn horizontally through the middle of each task bar.
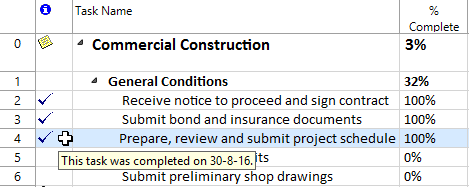
The completed tasks are easily to spot with Project Plan 365. You may look in the Indicators column (the one next to the ID column in the Gantt Chart view) and tasks that are completed, having % complete = 100%, are visually marked with a special checked icon .
You can enter a % complete quickly with the mouse. In Gantt panel point to the start bar of the task representation. When the pointer changes to a %complete arrow, drag right to increase the percentage complete value or drag left to decrease the percentage complete value.
To see the total % Complete of your project, check Show Project Summary Task option. The Project summary task shows the overall % Complete. Or check Statistics dialog from Project menu (Project menu → Project Information → Statistics).
Click here for more information on how to record the progress made on the project.
 Practice
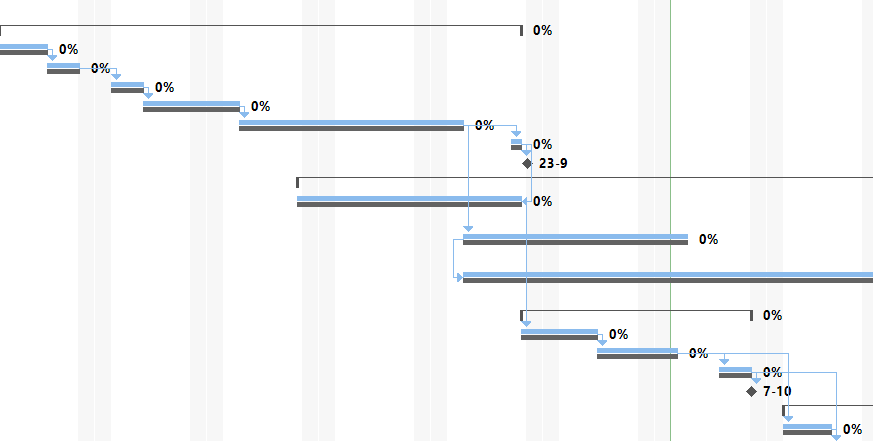
1. Using the commercial construction project plan created during Lab 7 - Track Construction Plan, switch to the Tracking Gantt view. Notice in the right chart, that all the taskbars have displayed at their end 0% complete, because the project hasn’t started yet.
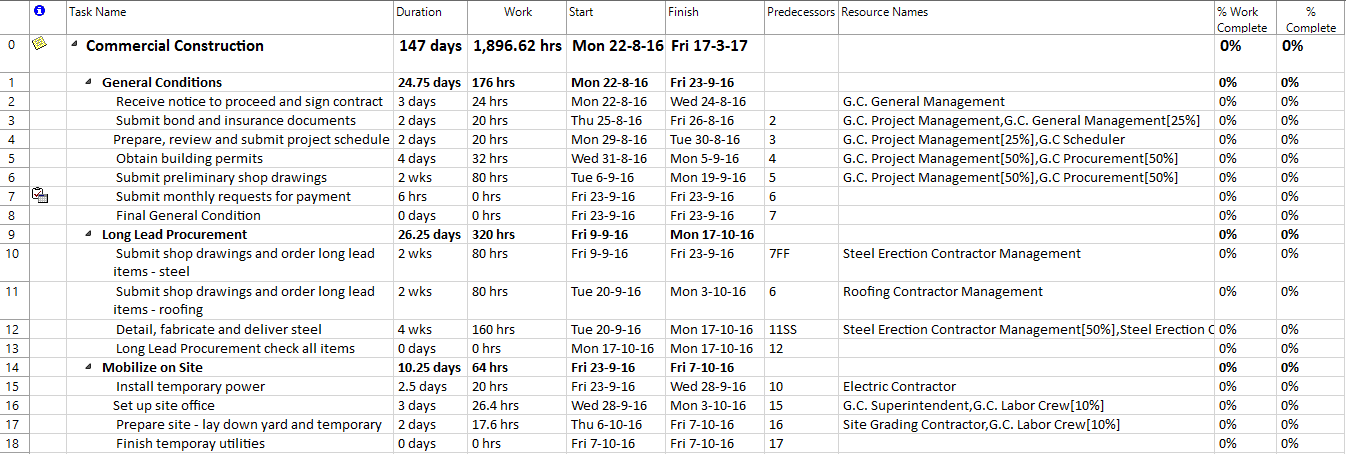
2. Now let's start to track our progress as the project actually starts and people actually start to do the work. Thus, you will enter progress for the tasks by changing the % Complete field. Make sure that the table in the left is Entry, which is the default one. Enlarge the left panel, so you can see more content of it. If you look closely, in the Entry table the rightmost column is called % Complete. Percent complete is an important aspect to updating and tracking project status. This lesson refers only to % complete of a task, which is in terms of task duration and relates to the schedule. More exactly, the % complete contains the current status of a task, expressed as the percentage of the task's duration that has been completed. But there also exists another field called % Work Complete, which is based on the work of a task, according to the resource assignments. So if you right-click on % Complete column, select Insert Column and specify % Work Complete in the Column Definition dialog, you will see it in the Entry table. Do not mix them up.
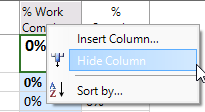
Now, hide % Work Complete column, since you will no longer use it. So right-click on this column and choose Hide Column:
3. % Complete is a task field, that you can enter in different ways in Project Plan 365. A simple and straightforward manner for indicating progress of a task is to directly type a percent complete value in the % Complete column. Let’s move this column by dragging and bring it in front of the Duration column, so you can see it more easily next to each task name. As you can see now, all the values in the % complete column are equal to 0%. A 0% percent value in the % Complete column means that the task has not started yet.


If you hover over the tick, you will see that it indicates that the task is completed and the date of its completion.
5. There is also the option of entering values of percent complete for tasks in between 0 and 100%. For instance a 25% value means that the task is under half way, but started, 50% means that the task is half done, whilst a value of 75% means that the task is over half way, but not done, or you just can freely insert whatever value you want in the % Complete column. Now let’s assume that the recorded progress for task with id = 39, named "Install millwork and wood trim", is 50%. In the % Complete cell corresponding to this task, type 50.

6. In the right panel, notice that the % complete values displayed at the end of bars are updated, to show the % complete of each task.


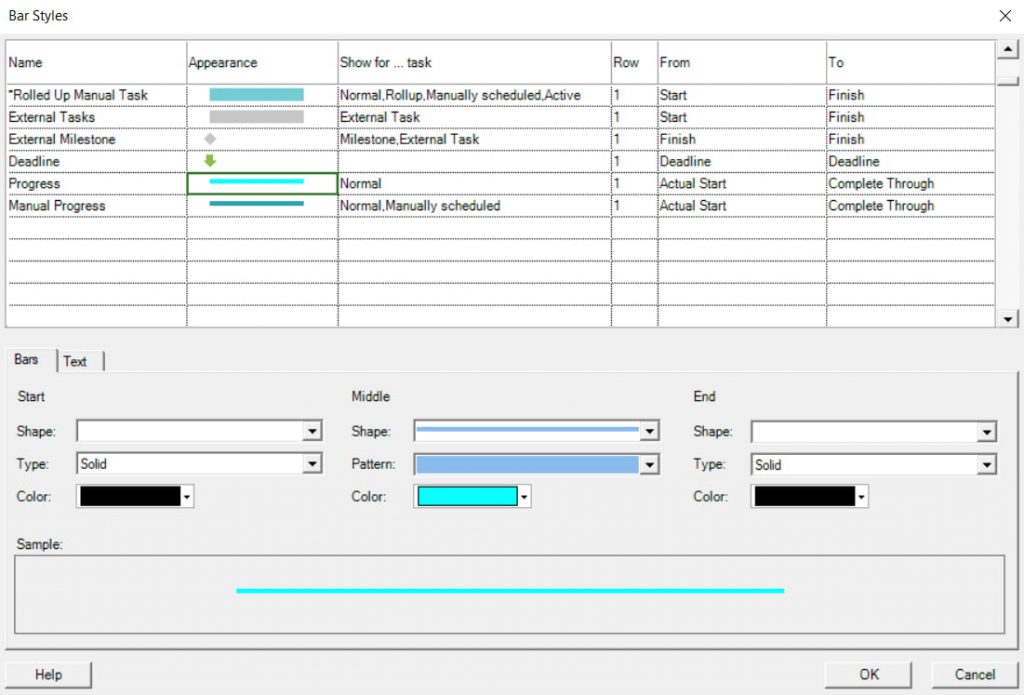
For the task called "Install millwork" and wood trim, which is only 50% complete, you can see that in the right side chart, the aqua bar inside the task is halfway across it.

9. Now, since you’ve entered some percent complete values for tasks, you may see that these values are rolled up to the above summary tasks, which also get a % complete value, computed based on the subtasks they have. So up till now, the % complete of the "General Conditions" summary task is 32%, for "Building Finishes" is 9% and for the project summary task is 6%.

10. You can also specify the progress for a summary task and indicate its % complete. This value will be distributed among its subtasks. In the % Complete field of the task called "Team meeting and discussion with partners", enter 100 and see what happens. First notice that all of its subtasks are now also marked as being completed and for all the team meeting tasks it is displayed the checked sign in the Indicators column.
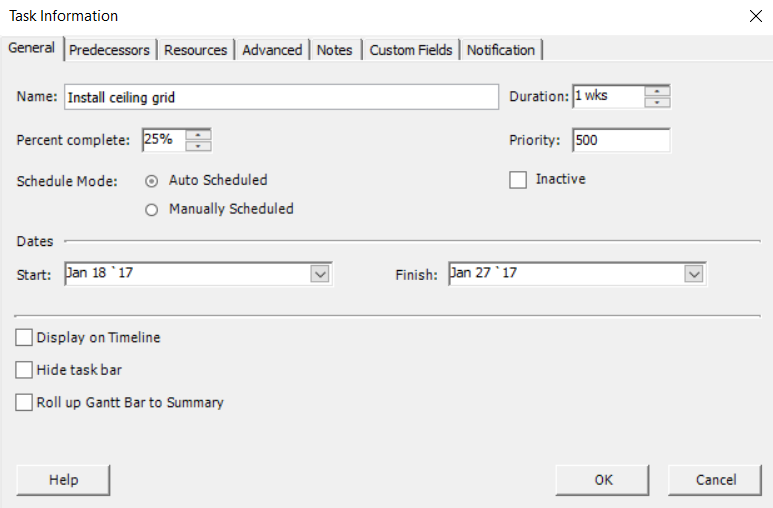
11. Another way of indicating progress for a task is to use the Task Information dialog. Let’s suppose that the "Drywall Contractor" resource allocated to "Install ceiling grid" task reports a 25% progress on it. For this, double-click on the task from row with ID = 43 to bring up the Task Information dialog for this task. In the General tab, you can use to control to indicate the percent complete you want. Let’s say 25%. Use the up arrow to increase the value of % complete.
12. You can also indicate the percent complete of a task in a visually manner by using the chart in the right. Let's consider the task called "Excavate foundations". To achieve this, first locate the bar corresponding to this task in the right panel. To indicate 100% complete for this task, in the right panel place the mouse to the start portion of the taskbar, when you will notice that the mouse indicator changes to a specific icon.
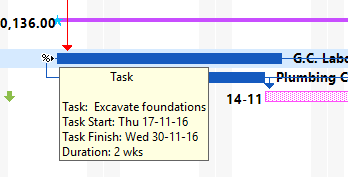
To indicate progress for a task, hold down the mouse and drag to the right the thin grey bar displayed inside the task bar to increase the value for the % complete field. Release the mouse when you reach the end of the bar, such that the % complete to be 100%. Once you’ve done this, notice the aqua thin bar inside the task that covers all of its length:

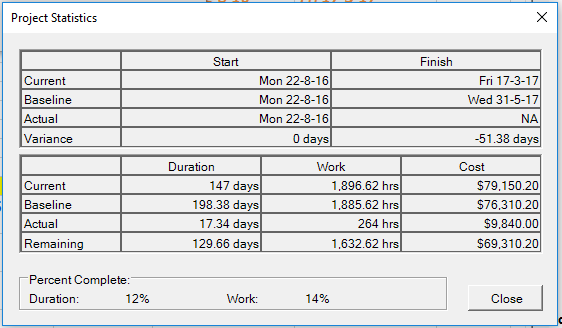
13. Now that you’ve finished indicating progress for the tasks, notice which is the overall % complete of the project, by looking in the % Complete cell from the first row, corresponding to the project summary task. You can see that the commercial construction plan is 12% completed.

14. At the same time, if you go to the Project menu and press on Project Information, then hit the Statistics button, notice here the computed values for the % Complete and % Work Complete.
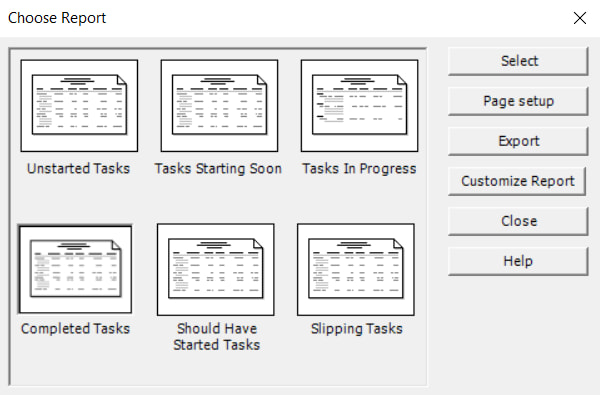
15. You can use reports to have a quick overview on the completed tasks from your project. This facility is especially useful in case of large projects, when its more difficult to spot the finished tasks. Go to Report menu and select Current Activities category, then choose Completed Tasks, and then you will see that a report is generated for you, which you can save or print later on if you want.
This is what you should get:
 Video
Video
If you prefer to see things in action, rather than reading text, watch out this video, which covers some of the topics from this section.
HOME <<PREVIOUS NEXT>>


