
If you have a project spread over a long period of time, you may find useful the Zoom functionality when applied to the timescale from Gantt panel. This allows you to rapidly get an overall picture of how the tasks in your project are linked over the timespan of your project.
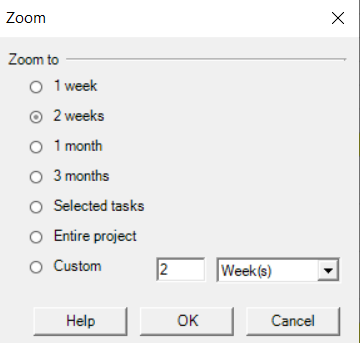
The Zoom feature available in Project Plan 365 allows you to choose the amount level of details you want to see in the current view. The Zoom engine currently implements seven levels of details:
- One week level (the visible unit is one week).
- Two weeks level
- One month level (the visible unit is one month).
- Three months level
- Selected tasks
- Entire project
- Custom level: the user can select multiples of Days/Weeks/Months/Years to see in the chart panel or in the print preview format.
Every time a view is selected, the view displays the chart information according to the last zoom selection (the default if none).
The Zoom functionality is available in Gantt Chart, Tracking Gantt, Resource Graph, Network Diagram, Task Usage, Resource Usage and other related views. The zoom utility may prove useful especially in case of Network Diagram view, which allows you to get a quick overview of the tasks and the dependencies among them by using a low level of zooming.
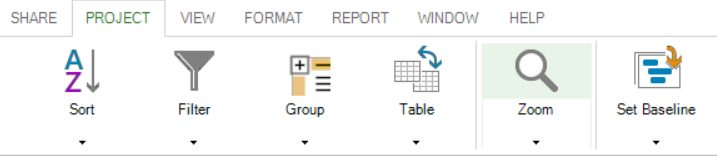
The Zoom functionality can be found in Project menu:
 Practice
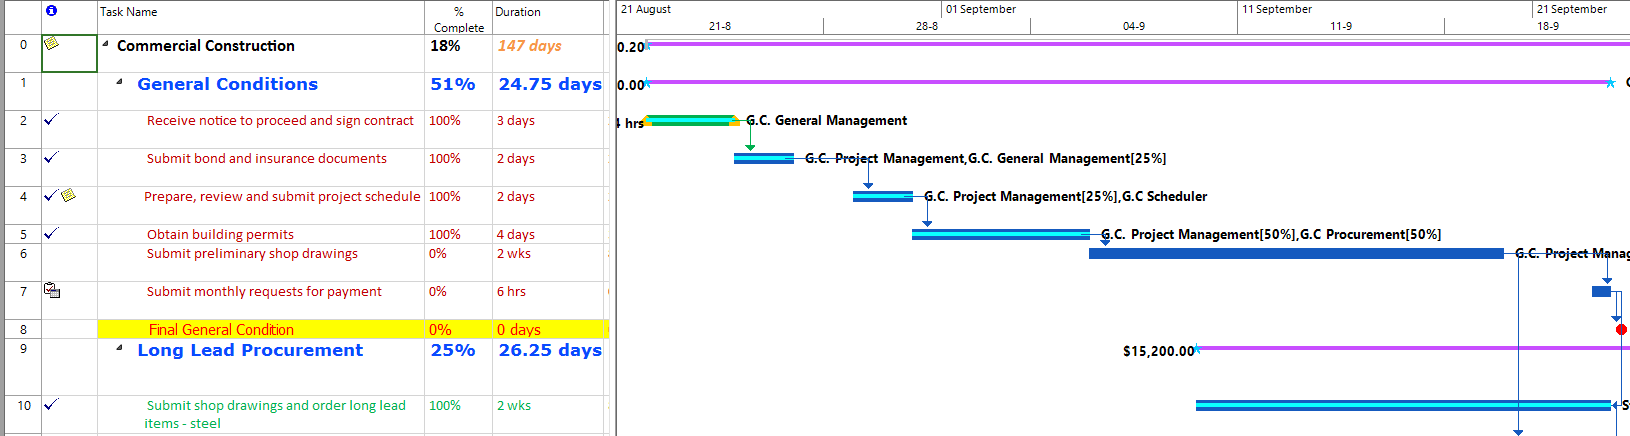
1. In the Gantt Chart view of the current project plan, go to Project menu and click on Zoom option. Choose 1 month.
Your project plan should look like below:
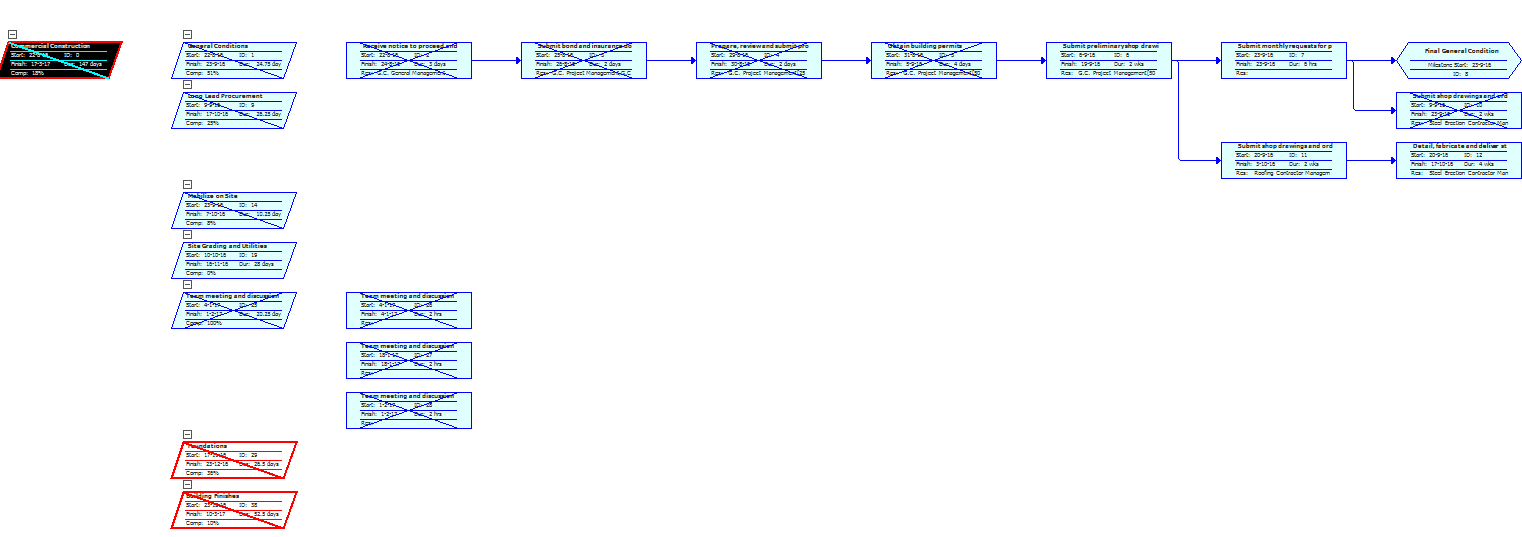
2. Switch to Network Diagram view, and choose a zoom level of 50%. You should obtain something like below:
 Video
Video
If you prefer to see things in action, rather than reading text, watch out this video, which covers some of the topics from this section.