What is the Gantt Chart view?
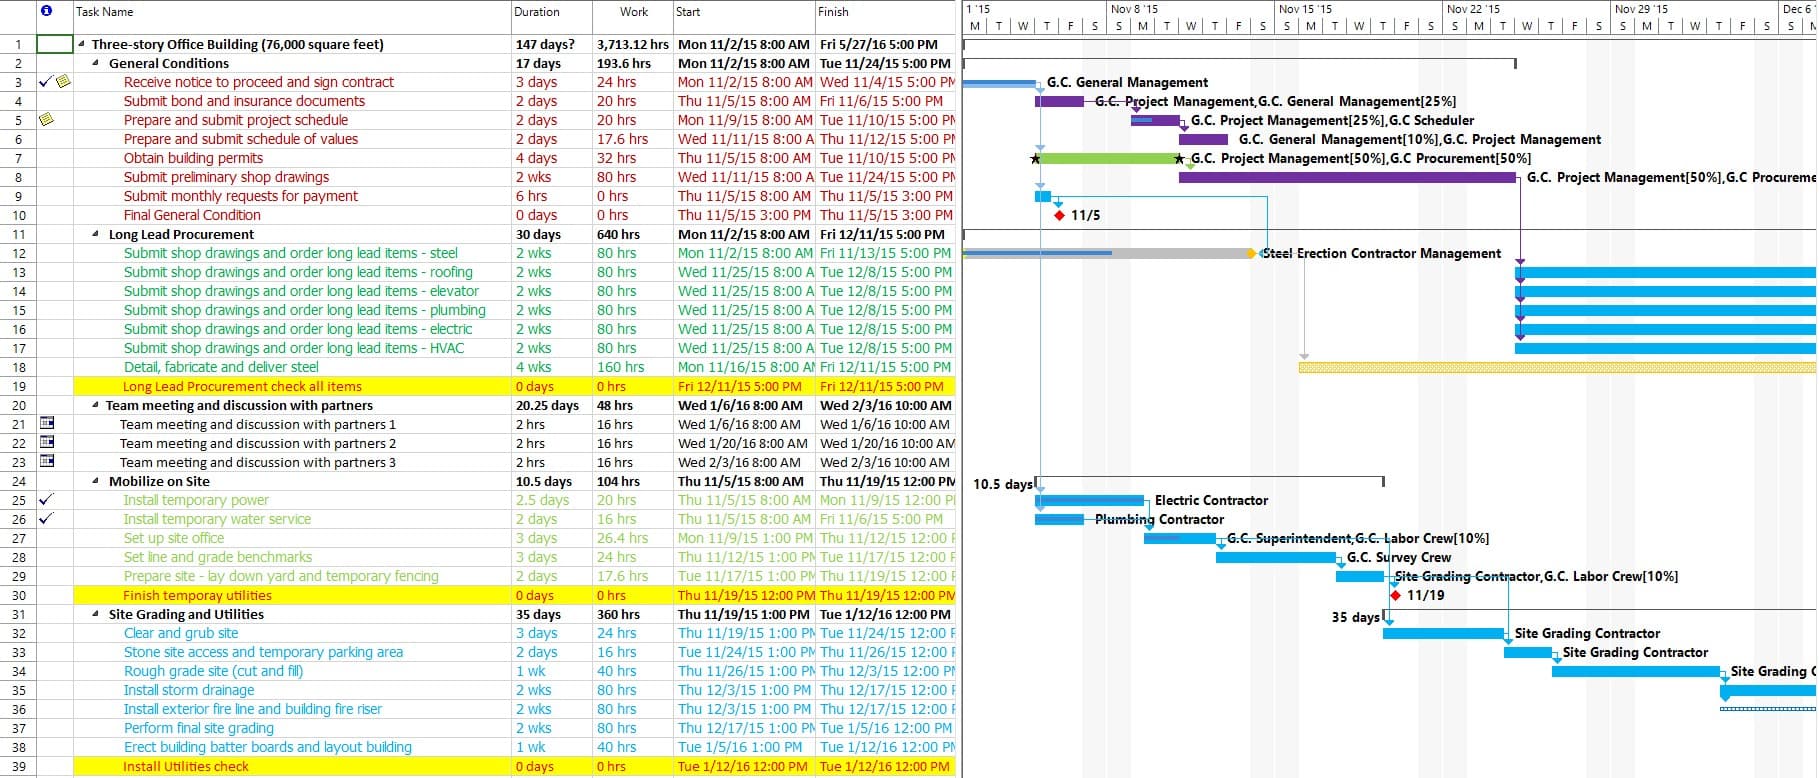
The Gantt Chart view displays task information in two panels: the left panel displays information as a sheet and the right panel displays information as a chart. Panel 1 displays the task information as a sheet and includes details about start and finish task dates, resources assigned to them, or % complete. The following columns are usually referred: Id, Indicators, Name, Duration, Start, Finish, Resource Names, Percent Complete, Predecessors. Panel 2 displays the Gantt bar representation of the tasks. The bar's length and position on the timescale indicate when that task begins and ends. In addition, the position of one task bar in relation to another indicates whether the tasks follow one another or overlap.
When should I use the Gantt Chart view?
Use the Gantt Chart chart view to:
- View tasks graphically while still having access to detailed information about the tasks.
- View tasks as rolled-up bars or milestones on their respective summary task bars, enabling you to see your whole project without losing sight of the tasks.
- See how tasks progress across time and evaluate the slack and slippage between tasks. You can track progress by comparing planned and actual start and finish dates, and by checking the completion percentage of each task.
- See how tasks progress across time. Review progress by comparing planned (baseline) dates and actual start and finish dates, and by checking the progress of each task.
- See the baselines the project manager saved for the project.
For more benefits of using the Gantt Chart view, please check the All About Gantt Chart page, which also includes a video.
How do I use the Gantt Chart View?
In order to use the Gantt Chart view, go to menu View - Gantt Chart. Please know that the Gantt Chart view is the default view for the new projects.
How do I customize or format the Gantt Chart view?
To customize the Gantt Chart view, you can change:
- Layout options - options for drawing the links between tasks, date format, bar height, etc.
- Bar styles - the styles for drawing the bars and displaying information about bars in the particular view
- Text styles - the font styles for the various texts in the view
- Bar formatting - the specific formatting of a particular bar in the chart, in case the project manager intentionally changed the format to make the task stand-out from the others by its visual presentation
- Row, Column, and Cell Font formatting - the specific font formatting of a particular row, column, or cell in the sheet portion of the view, in case the project manager intentionally applied a different format to highlight the particular task, field, or value
- Progress Lines formatting - the progress lines activated for the view and formatting options related to them
- Timescale formatting - the formatting of the different timescale tiers, as well as the calendar and presentation of the working and non-working days
- Gridlines formatting - the formatting of the different gridlines for the sheet and chart portions of the view
- Drawings - the different drawings and text boxes placed on the chart by the project manager, in order to place additional information for the tasks or emphasize a certain phase in the plan.
You are also able to customize the Gantt Chart views, using one of the following opportunities:
- Change the different Layout options for the active Gantt Chart view.
- Display, hide, or change the appearance of the timescale tiers.
- Display, hide, or change the appearance of nonworking time.
- Create a combination view for the Gantt Chart view to display additional information about the tasks or about the resources assigned to those tasks in a different view.
How are the Gantt bars drawn in Gantt Chart view?
By default, the Gantt chart displays blue bars for common Tasks, black diamonds for Milestones, blue bars connected with suspension dots for Task Splits, black bars for Summary Tasks. The background displays the Project's calendar time span.
How is the deadline displayed in Gantt Chart view?
A deadline indicates the target date when the user wants a task to be completed. The deadline is displayed in Gantt chart as a green arrow.
How to minimize/maximize the display sheet?
In order to minimize/maximize the Gantt Chart, pull to the right/left the bar that separates the grid from the Gantt Chart.
How are the task dependencies displayed in Gantt Chart view?
The Gantt panel display links that show the predecessor or the successor relation between tasks.
Can I add bar texts in Gantt Chart view?
A various project information (such as duration, constraint type, finish etc) can be used for the bar texts in order to describe a task. The position of the bar texts can be: left, right, top, bottom and inside. To add a bar text, double click on that specific bar and in Bar Text tab select the information that you want to be displayed.
How do I apply a different table in Gantt Chart view?
The sheet portion displays categories of information about the tasks, arranged in tables. For example, the default table for the standard Gantt Chart view is the Entry table, but you can select any of the Gantt Chart tables by going to menu Project - Tables.
How do I apply a filter in Gantt Chart view?
The Gantt Chart view can use any of the task filters to display only the tasks you want to see. When you select a filter, both the sheet and chart portions of the Gantt Chart display the information as defined by that filter's criteria. The default filter is the All Tasks filter. To apply a filter, go to menu Project – Filter.
How to delete the line set to the current day from the Gantt Chart view?
To remove the line set for the Current Date on the Gantt Chart view, go to Format in the menu, then Gridlines. In the Gridlines dialog select the Current Date and on Type choose the blank option.
Can I introduce a picture in my Gantt Chart?
We are sorry, but you cannot add a picture in the Gantt Chart view. You can only attach a hyperlink to a task.
How do I group tasks in Gantt Chart view?
To group the tasks in Gantt Chart view, please go to menu Project - Group.
How do I sort the tasks in Gantt Chart view?
To sort the tasks in Gantt Chart view, go to menu Project - Sort.
How do I zoom in or zoom out in Gantt Chart view?
You can apply a zoom in/zoom out in Gantt Chart view by going to the Project menu - Zoom. In this way, you can zoom out to get a bigger picture of your project’s tasks by displaying Years and Months and you can zoom in to see the exact start and finish dates for your project’s tasks by changing the timescale to Weeks and Days.
How do I assign resources to tasks in Gantt Chart view?
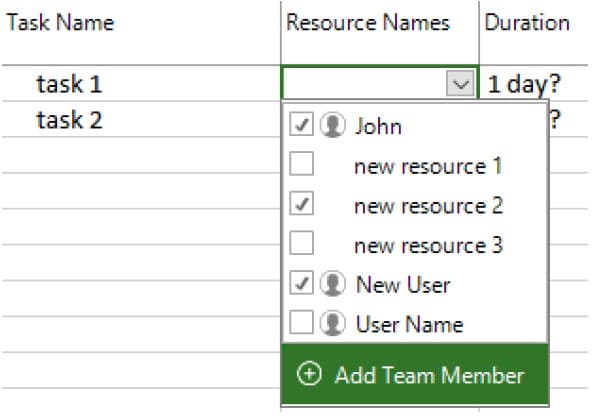
To assign resources to tasks in Gantt Chart view, you can import the existing team members from your organization or to add other resources. To assign an existing team member from your organization to a task, in Gantt Chart view, click on the down arrow in Resource Names field. A drop down list will appear with resources that are part of your organization (marked with an icon) and your local resources added in your project. To add another resource that is not a team member yet or is not part of your project, simply insert his name in Resource Names field. Later on, you can invite that specific resource into your organization by going to menu Resources – Export Team Members.
How to change the height of Gantt bars?
To change the height of Gantt bars go into Gantt Chart view then click on Format - Layout and change in the Bar height dialog box the size of the bars then press ok.
How to make a copy of the Gantt Chart view?
To make a copy of the Gantt Chart view, you can use the Export to PDF or Export to Image features located under menu File - Import/Export.
On what platforms can I import team members from Gantt Chart view?
You can import team members from Gantt Chart view only on Windows, Mac, iOS and web application.
How to make the Gantt Chart smaller?
To make the Gantt Chart smaller, position the cursor on the middle bar between the grid and the Gantt Chart until a two-arrow icon appears and then drag the bar to the right.
Is there any way to set a default view?
To set a view by default, the Editor needs to save the file with that specific view being opened.
What are the grey vertical bands in the Gantt Chart?
The grey vertical bands in the Gantt Chart represent the non-working time.
Best uses for Gantt Chart view:
Use the task list
You can list each of your project's tasks in the grid portion on the left side of the Gantt Chart view, and then organize them into a hierarchy of summary tasks and subtasks. You can also link tasks together, to show task dependencies.
For more information about how to insert a task or a recurring task, please read the article below:
Allowed actions:
- Create and insert a new task (single or recurring)
- Outline tasks into subtasks and summary tasks
- Create task dependencies (links) within your project
- Create and link tasks
Use the chart
In addition to the grid portion of the view, the Gantt Chart view also provides an illustrated version of your task list, with Gantt bars that show the duration of your project's tasks across a timeline. This part of the Gantt Chart view is called the chart. For each task, the associated Gantt bar begins at the start date, and ends at the finish date. If you have linked tasks together, the Gantt bars are connected on the chart with link lines.
Allowed actions:
- Change the color, shape, or pattern of Gantt bars.
- Create a new type of Gantt bar, such as one that shows available slack or delayed tasks.
- Add text to Gantt bars.
- Display task names for individual Gantt bars on a summary task bar.
- Change the height of Gantt bars.
- Change the appearance of link lines between Gantt bars.
Highlight a task
In a complex project, the bar side of the Gantt Chart can start to look crowded.
Now when a task is selected, it’s “path” is highlighted, telling you instantly what the related task is.
What is Gantt Chart?
A Gantt Chart is a visual representation of a project plan, very popular in project management. Tasks are represented as horizontal bars along a timeline. The start/end dates and the duration of a task may be inferred from its projection on the timeline.
Can you show me a Gantt Chart demo?
You can read more about the Gantt Chats View in our Gantt Chart Online Article or in our All About Gantt Chart page, which also includes a video.
How do I hide/remove the Gantt Ghart from the project plan?
The Gantt Chart can't be removed. If you want to hide the Gantt Chart in the Gantt Chart View, you could position the cursor on the middle bar between the grid and the Gantt Chart until a two-arrow icon appears and then drag the bar completely to the right. Also if you want only the tasks to be visible you can use the "Task Sheet" view.
How to display actual start date in Gantt Chart section?
At this point, we do not support displaying the actual start date in Gantt Chart section.
How to see only Gantt Chart in the view?
To view only the Gantt Chart in the Gantt Chart View, you could position the cursor on the middle bar between the grid and the Gantt Chart until a two-arrow icon appears and then drag the bar completely to the left.
Step by step on how to apply the Gantt Chart view:
1. Go to menu View - Gantt Chart.
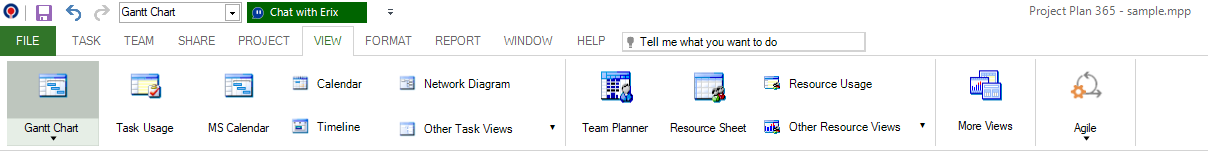
2. The Gantt Chart view is applied.
Step by step on how to import team members into your project using Gantt Chart view:
1. You can import Team Members using the Import Team Members dialog or by adding them from Gantt Chart.
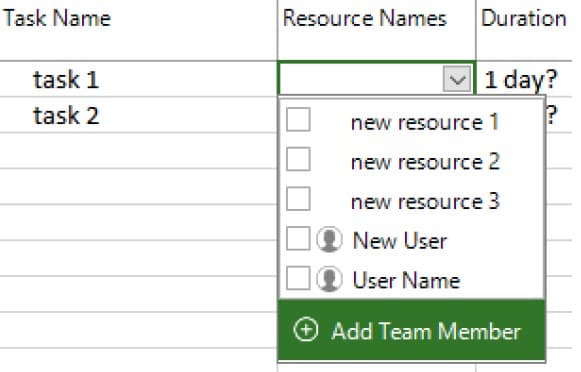
2. When you open the Resource Names drop-down menu, you will get a list of all resources in your project and the Team Members (marked with an icon). Note that all the Team Members are visible in this list (imported or not). Selecting any Team Member in this list will import it to the current project (only once). If you want to add a new Team Member, click Add Team Member button and the following dialog will be opened.
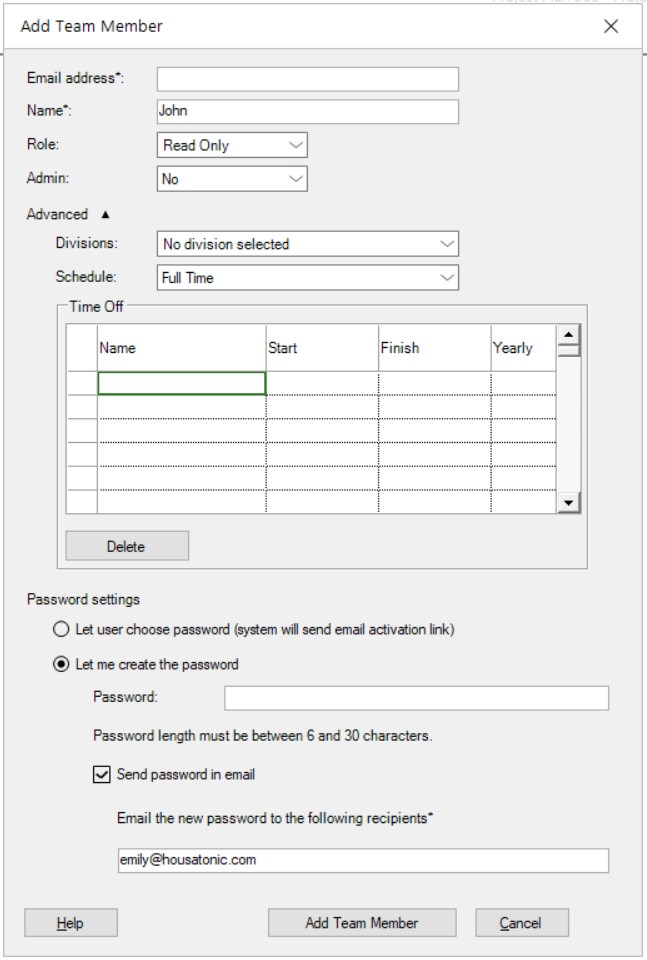
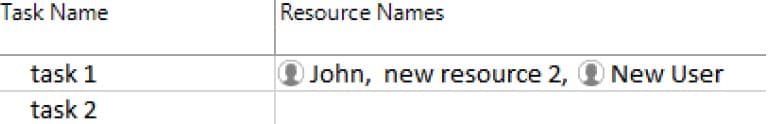
After clicking on the Add Team Member button, John will be added as a Team Member.
Note that the Imported Team Members that are assigned to tasks are shown in the Resource Names column with a distinct icon in front of their name.