Gridlines
Online Help > Gridlines
What does “Gridlines” functionality do?
Gridlines option is used for enhancing the visibility of a view, by changing the pattern and colors of gridlines (vertical or horizontal lines that divides columns or rows in a view).
How can I use Gridlines?
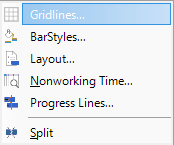
To make Gridlines changes in your project, go to menu Format - Gridlines or select Gridlines from the contextual menu (right-click on the right pane in Gantt Chart view).
How do I put out a current date line?
In order to apply a line for the current date, go to Gantt Chart view and go to menu Format - Gridlines and select the Current Date. Set the color and the line type and click on the OK button.
How to delete the line set to the current day from the Gantt Chart view?
To remove the line set for the Current Date on the Gantt Chart view, please go to the menu Format - Gridlines. In the Gridlines dialog select the Current Date and on Type choose the blank option.
How can I make the grid lines bolder?
You can see how to change the gridline appearance at: Gridlines.
How can I change the color for the sheet rows in Gantt Chart?
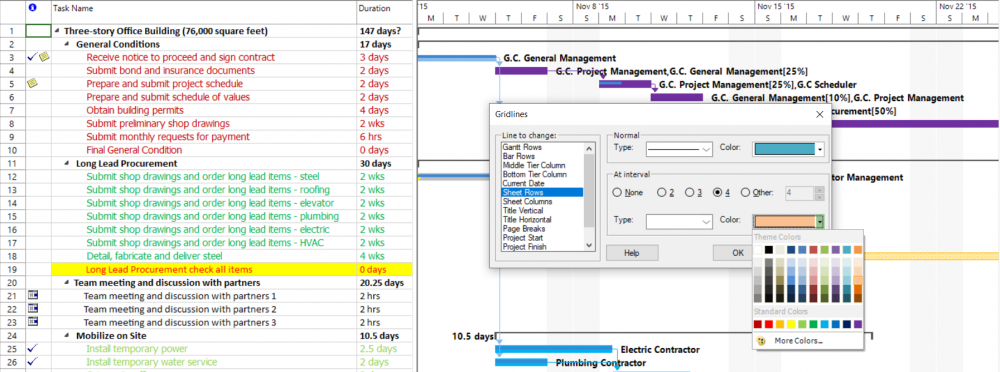
To change the color for the sheet rows, go to Format - Gridlines - Line to change - Sheet Rows then in the Normal section click on color and choose one from the given color palette.
Why I can’t see the “Gridlines” button in ribbon on the Mac platform?
If the “Gridlines” button is not visible in ribbon, please press "More" button. You should be able to find in the dropdown the button that doesn't fit inside the ribbon because of the small window size.
What does the “Help” button inside the “Gridlines” dialog do?
The “Help” button inside the “Gridlines” dialog redirects you to the “Gridlines” article in our Online Help page.
Step by step on how to format gridlines:
- Go to Format menu - Gridlines.
Or right click on Gantt Chart panel and select Gridlines.
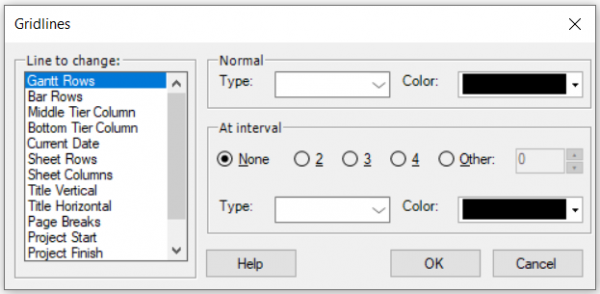
- The Gridlines dialog box will appear. Select the type of gridlines you want to change in the Line to change list.
- Select the line pattern you want to use in the Type box, under Normal.
- Select the line color you want to use in the Color box, under Normal.
- For setting contrasting gridlines at specified intervals, select a line Type, Color and interval under At interval.
- Click the OK button to save the settings.
Note: If you don't want a gridline to appear in a view, select the blank area in the Type box.
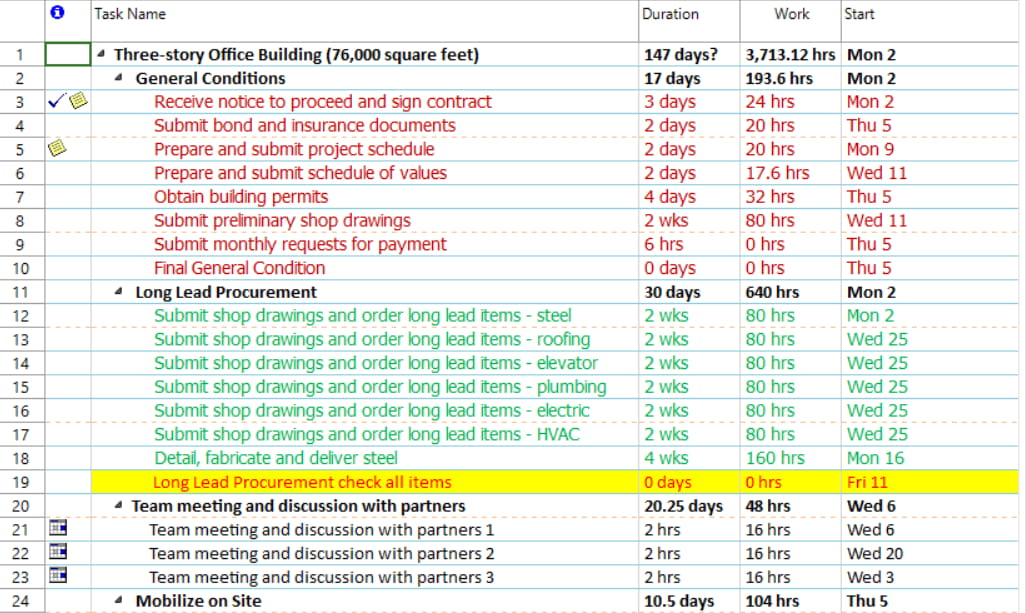
- Notice that the type of gridlines you have chosen changed.
| Related | Tracking Gantt | Timeline | Task Usage | Gantt Chart | Resource Usage |
| Platform | Windows | Mac | iOS | Web | Android |
| ✔ | ✔ | ✔ | |||
| Product | Project Plan 365 | ||||
| Article ID | 131 | ||||
| Date | 9/16/2024 |


