
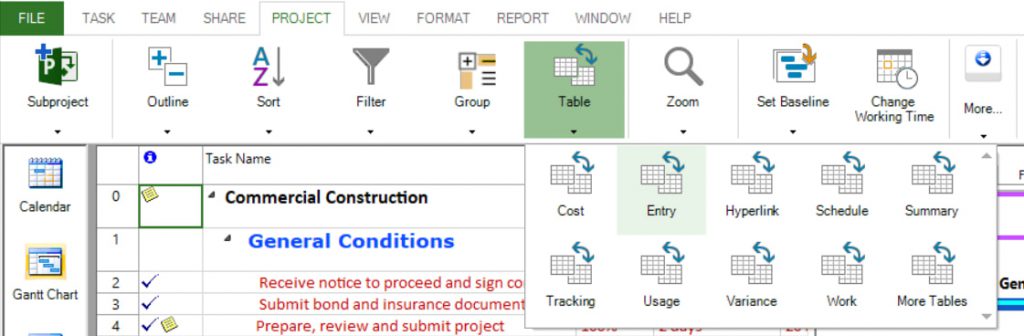
Project Plan 365 provides a set of tables used to show specific information about tasks, resources, and assignments in a sheet view. A sheet view, which contains a list of tasks or resources, is defined further by a table, which is a group of related columns or fields. The columns seen in a sheet depend on the table applied. In Gantt Chart view the default table is Entry.
To apply a table to the view, point to Table on the Project menu and then select the table you want to apply.
There are two types of tables:
1. task tables (which are applied to task type views)
2. resource tables (which are applied to resource type views)
Task Tables | Resource Tables |
|---|---|
Baseline | Cost |
Constraint Dates | Earned Value |
Cost | Entry |
Delay | Entry Material Resource |
Earned Value | Entry Work Resource |
Earned Value Cost Indicators | Export |
Earned Value Schedule Indicators | Hyperlink |
Entry | Summary |
Export | Usage |
Hyperlink | Work |
Rollup | |
Schedule | |
Summary | |
Tracking | |
Usage | |
Variance | |
Work |
To use a view that is not on the menu, click Project menu →Table → More Tables.
 Practice
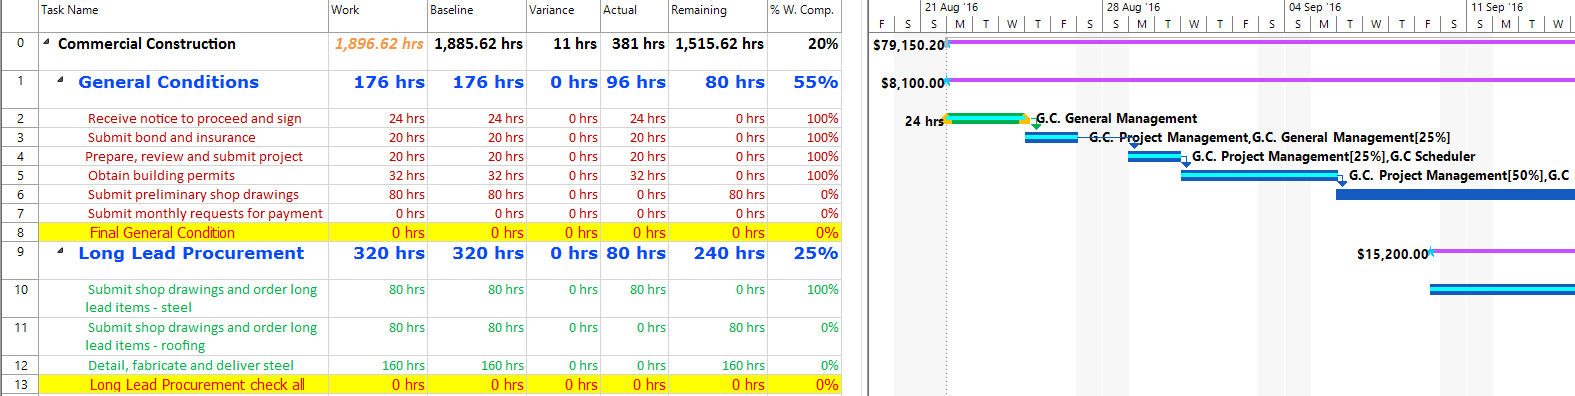
1. Use the Commercial Construction project plan created during Lab 8 - Entering Progress. In Gantt Chart view apply the Work table (to apply a table to a view, use the Table option available under Project menu). What you will notice?
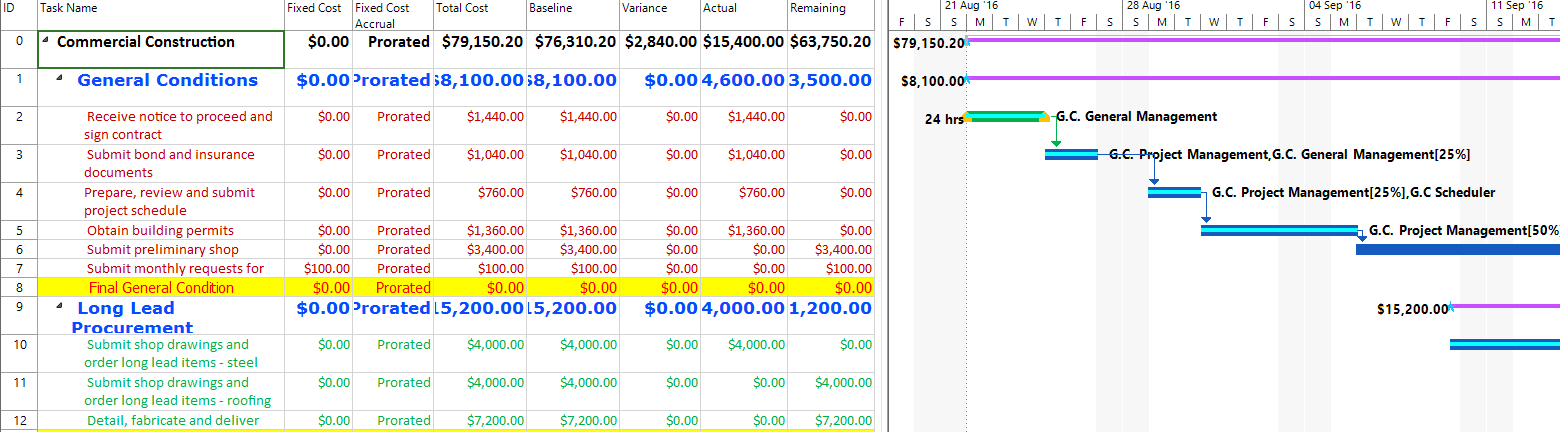
2. Review costs associated to the project. In Gantt Chart view apply the Cost table. The following columns will be displayed in the view: Fixed Cost, Total Cost, Actual Cost and Remaining Cost.
 Video
Video
If you prefer to see things in action, rather than reading text, watch out this video, which covers some of the topics from this section.