
Views are used to enter, change, and display information about the tasks and resources in the project. By using a variety of views, the same project information can be seen in different ways as the project is organized, tasks and resources scheduled, and changes managed.
There are two basic types of views to display project information:
1. A sheet resembles a spreadsheet or table of information.
2. A chart or graph displays information graphically.
The most commonly used views are accessed through the icons on the View bar or from the View menu. More views are available from View → More Views or by clicking the More views icon in the view bar.
Project Plan 365 can display project information in task views or in resource views. Use a task view to enter, change, or display task information. Use a resource view to enter, change, or display resource information.
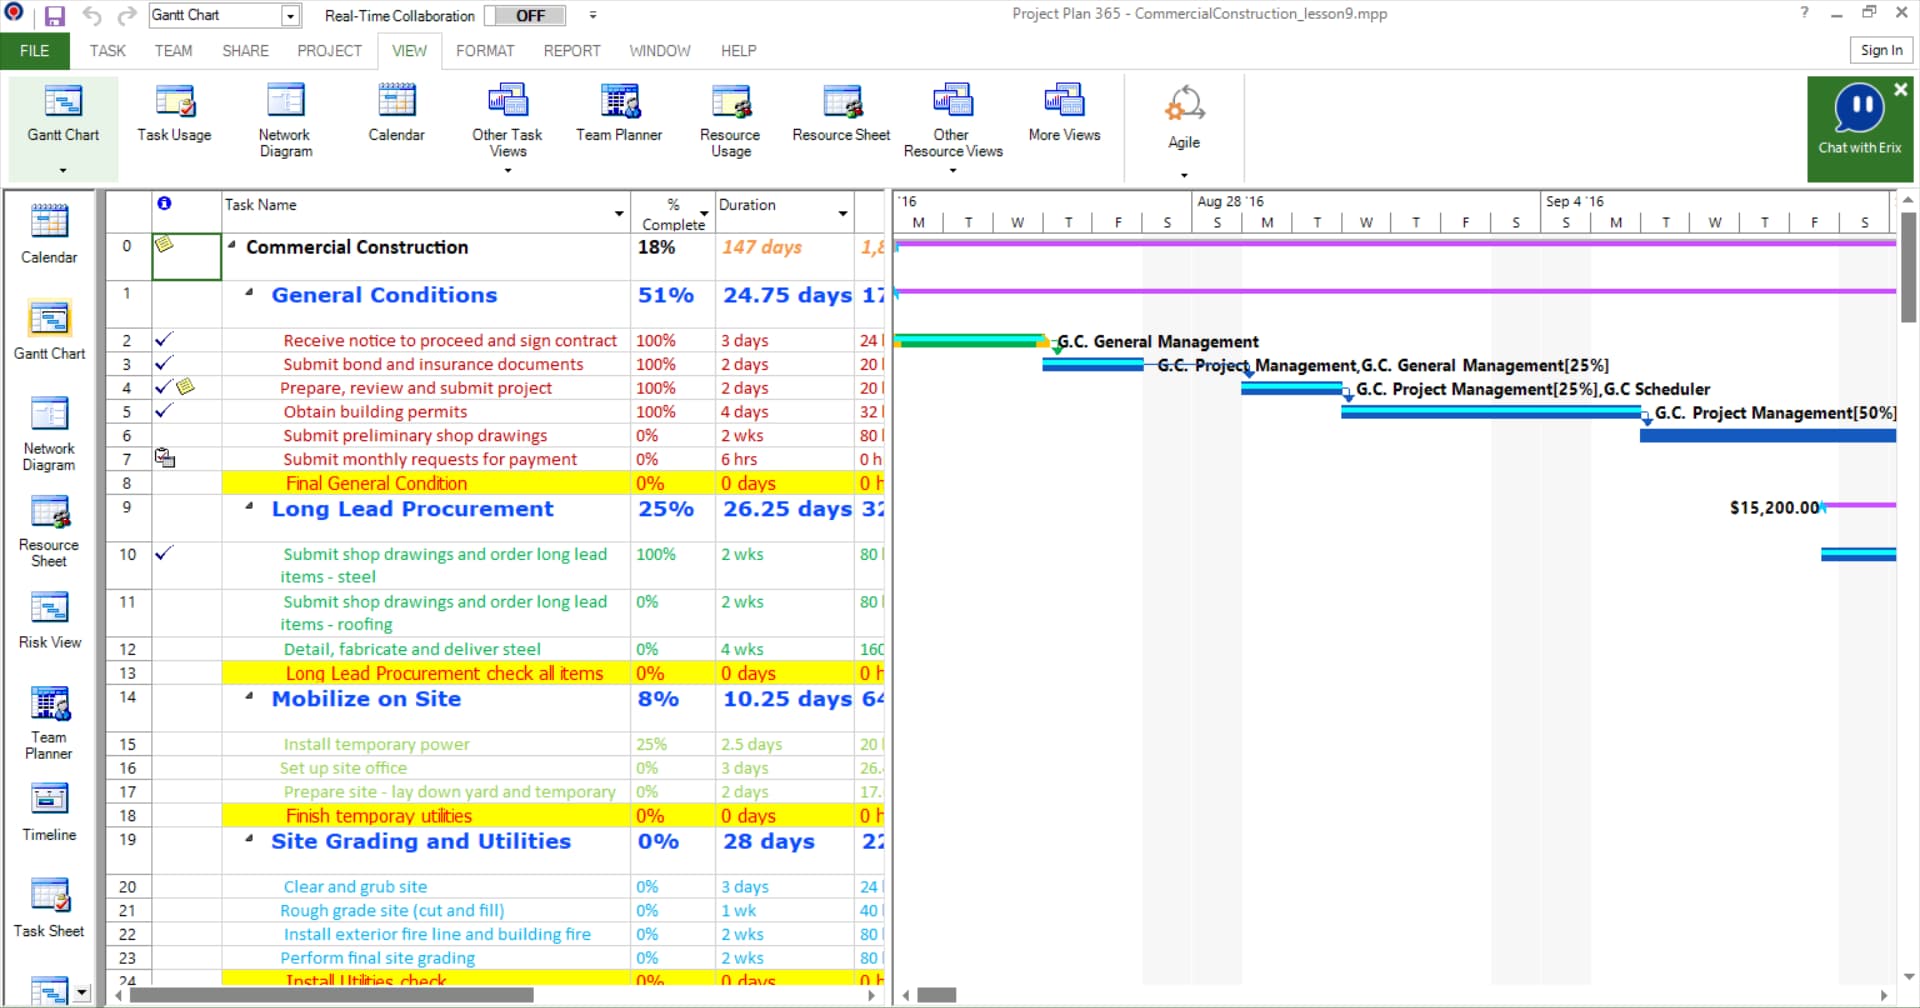
The Gantt Chart displays task information as both text and graphics: the Gantt table lists information about each task, and the Gantt bar chart displays task durations and start and finish dates on a timescale. The relative positions of the Gantt bars show you which tasks come before or after or overlap the task represented by each bar.
You can use a Gantt Chart to:
- Create a project by entering tasks and task durations.
- Establish sequential relationships between tasks, so you can see how changing task duration affects the start and finish dates of other tasks and the project finish date.
- Assign personnel and other resources to tasks so you can use those resources as efficiently as possible.
- Track progress by comparing baseline and actual start and finish dates and by checking the percentage of each task that is complete.
 Practice
1. Use the Commercial Construction project plan created during Lab 8 - Entering Progress. File is opened on default view Gantt Chart:
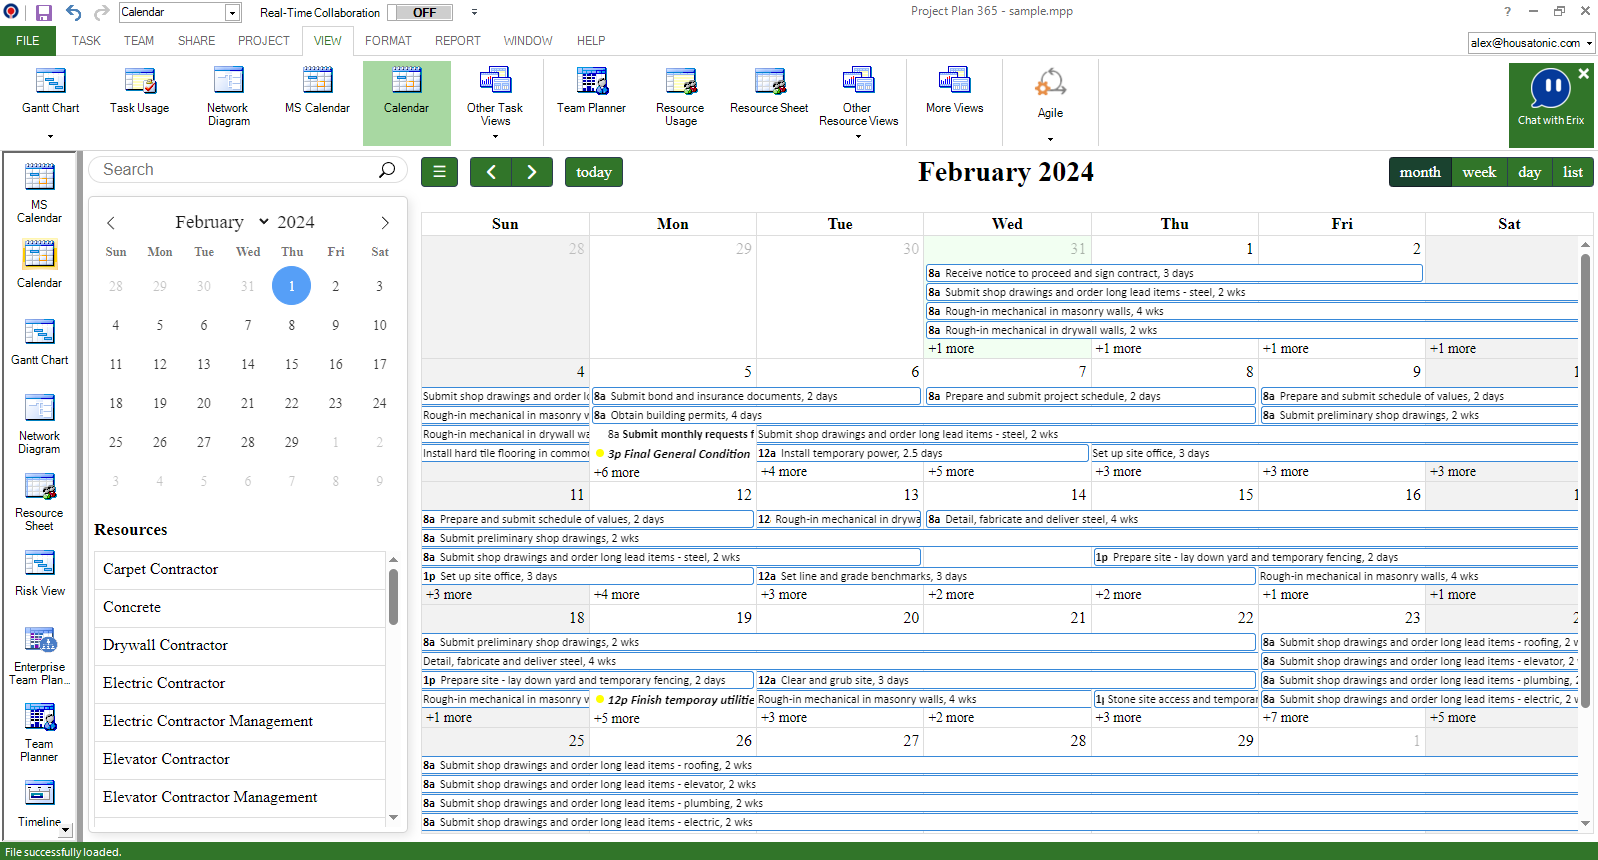
Calendar
Calendar is the view that presents the tasks in a graphical manner on a day to day map. With blue bars for common tasks and black bars for milestones, tasks show their span over days or weeks. Tasks can be moved or edited (just edit duration using drag & drop options). Select View → Calendar or click the Calendar icon on the View Bar. To navigate in view: click on the date, or use the up or down arrows to scroll through the dates.
Practice
1. Use the Commercial Construction project plan created during Lab 8 - Entering Progress. File is opened on the default view Gantt Chart:
Select View → Calendar or click the Calendar icon on the View bar.
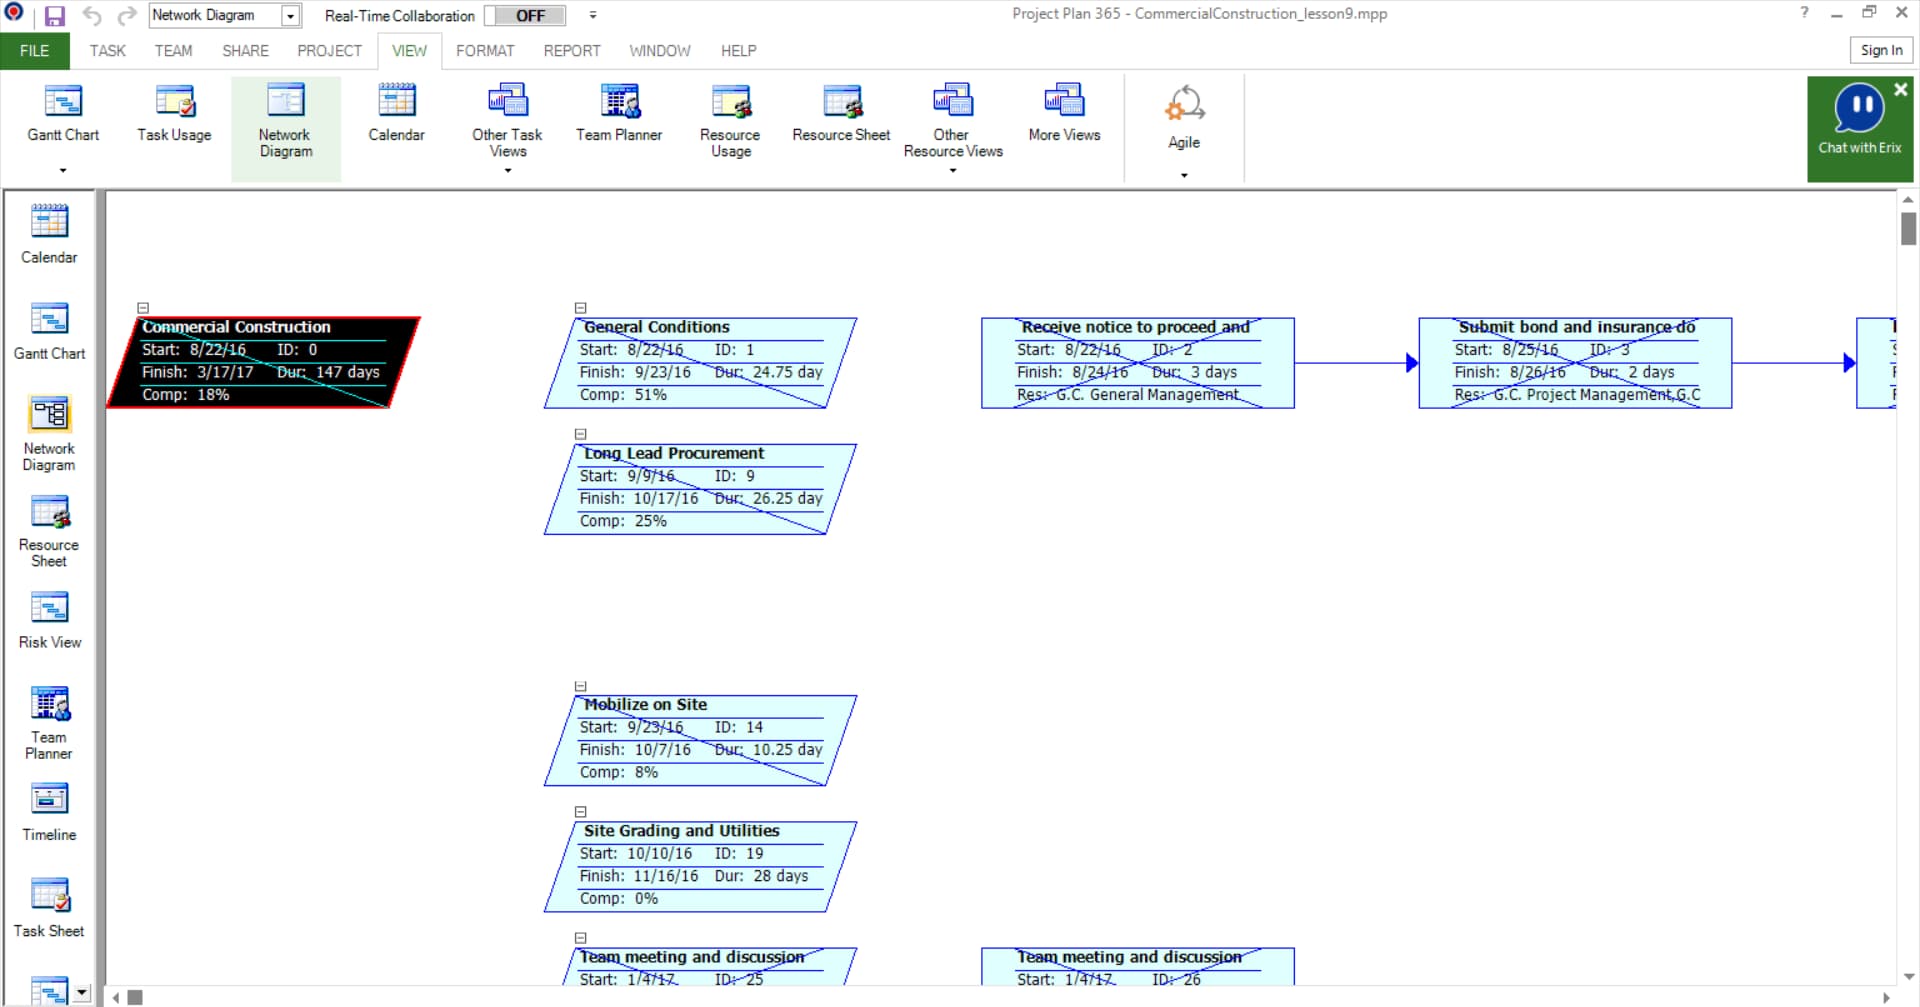
In Network Diagram tasks are represented by boxes, or nodes, and task relationships are represented by lines that connect the nodes. Is a logic chart showing all tasks. Use this task view to view and fine-tune the schedule in a flowchart format.
Practice
1. Use the Commercial Construction project plan created during Lab 8 - Entering Progress. File is opened on default view Gantt Chart:
Select View → Network Diagram or click the Network Diagram icon on the View bar.
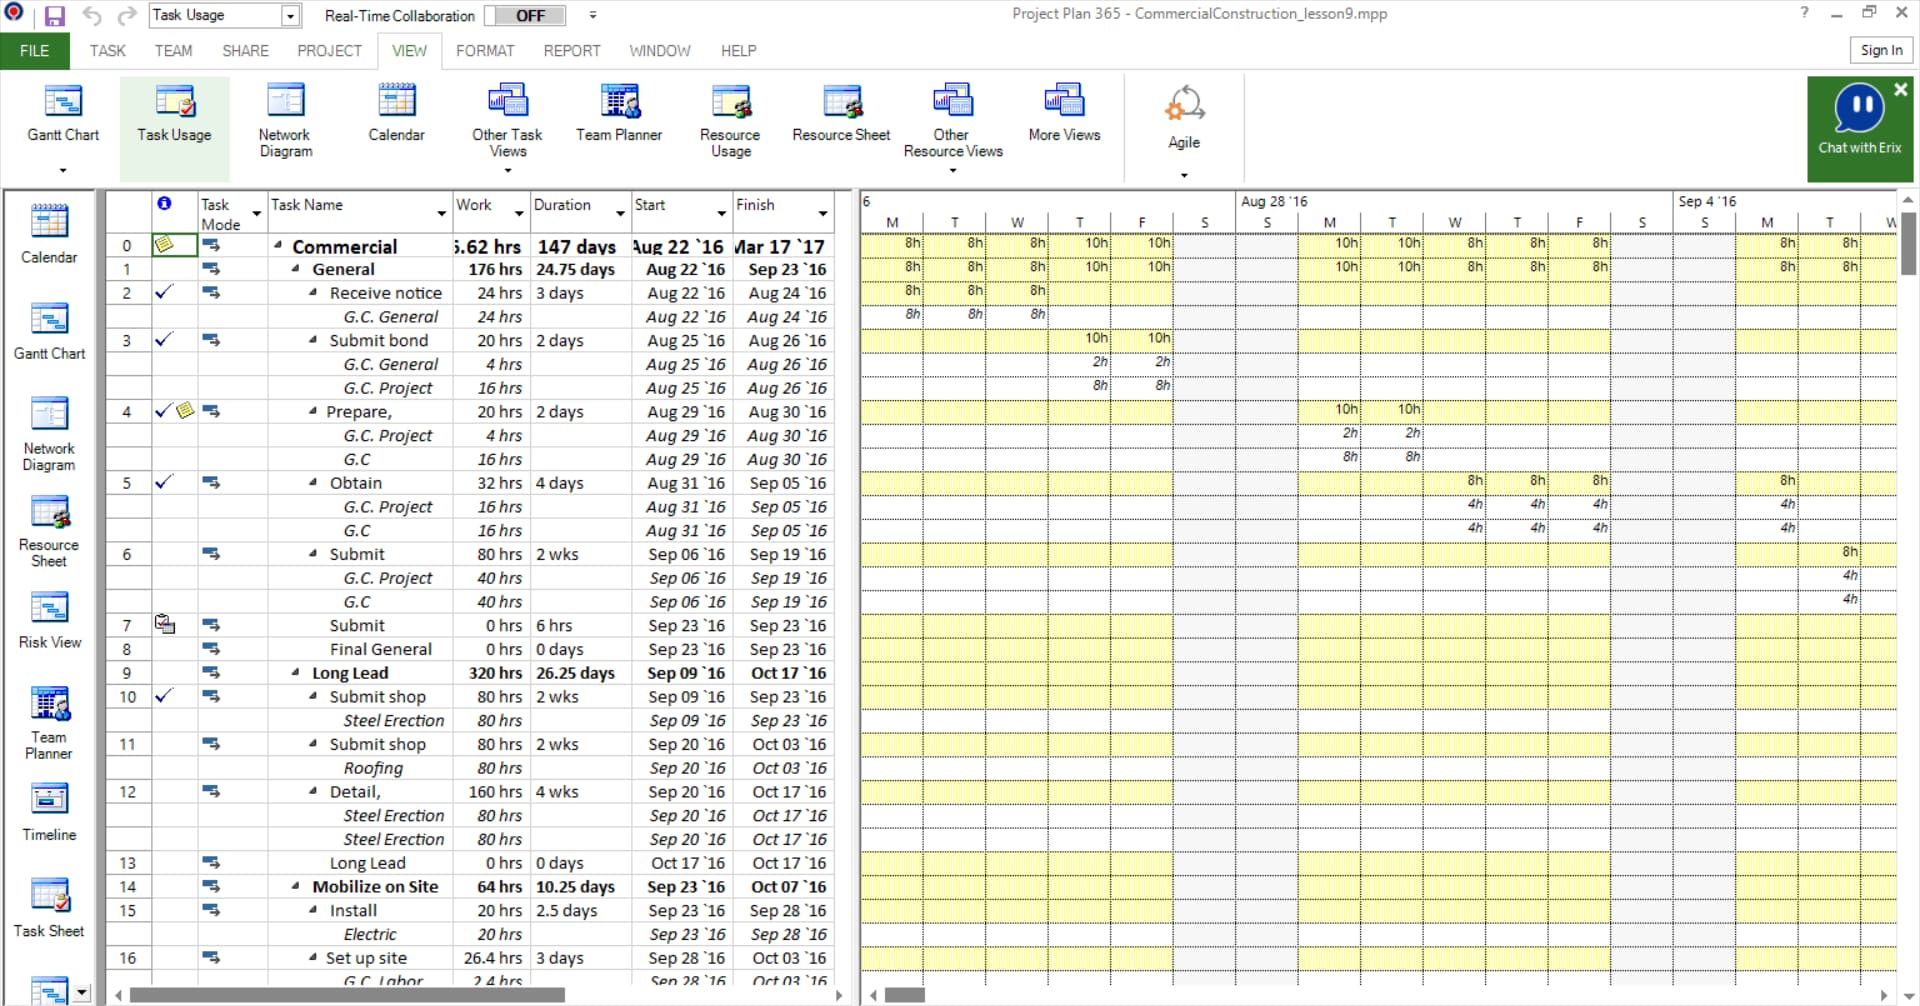
The Task Usage view is a list of tasks showing assigned resources grouped under each task. Use this task view to see which resources are assigned to specific tasks and to set resource work contours.
Use the view to work with task and resource information side by side. With the Task Usage view, useful, real-world reports can easily be created about when a resource is scheduled to work on a task over a period of time.
Practice
1. Use the Commercial Construction project plan created during Lab 8 - Entering Progress. File is opened on the default view Gantt Chart:
Select View → Task Usage or click the TaskUsage icon on the View bar.
The Tracking Gantt view provides a list of tasks and related information, and a chart showing critical path and scheduled Gantt bars for each tasks.
The Tracking Gantt view is list of tasks and related information and a bar chart showing planned and scheduled bars for each task. Use to compare with the actual schedule.
Practice
1. Use the Commercial Construction project plan created during Lab 8 - Entering Progress. File is opened on default view Gantt Chart:
Select View → Tracking Gantt or click the Tracking Gantt icon on the View bar.
![]()
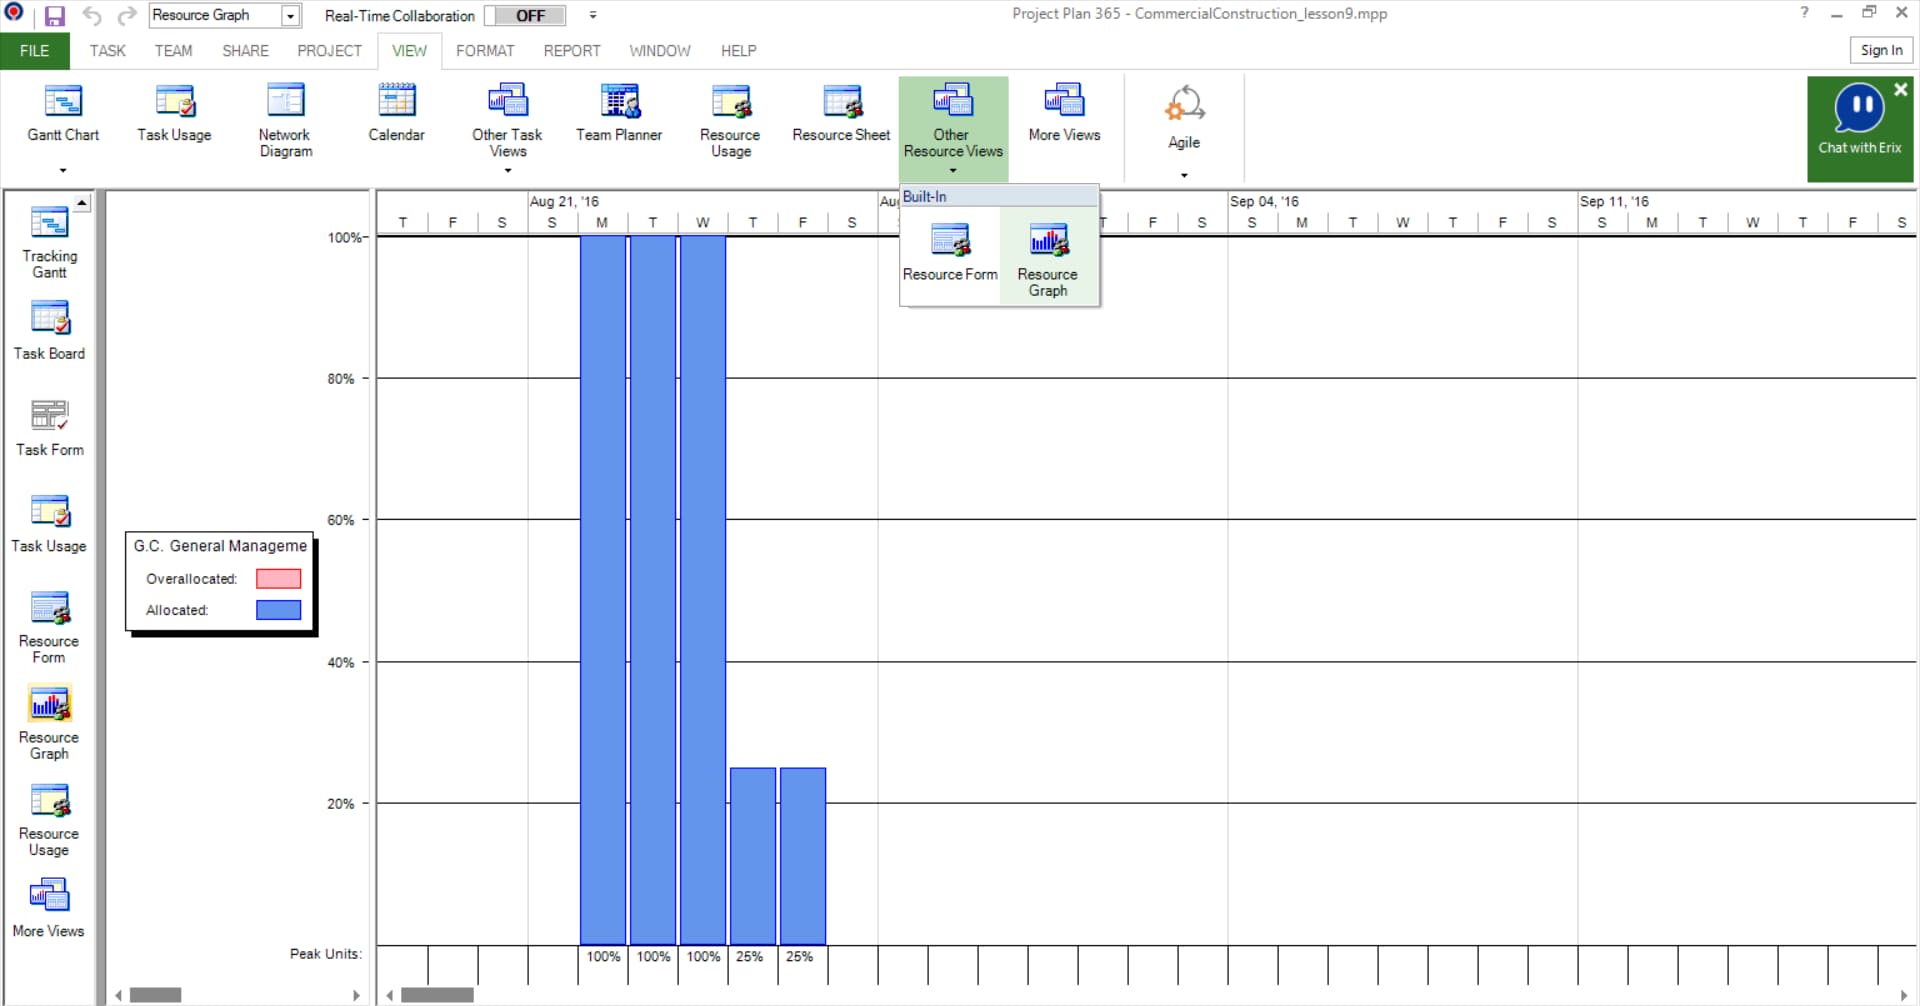
The Resource Graph graphically displays information about the allocation, work, or cost of resources over time. You can review the resource information for one resource at a time, for selected resources, or for a resource and the selected resources simultaneously. When you display both, you see two graphs --- one for the individual resource and one for the selected resources --- so you can compare them.
You can use a Resource Graph to:
- See which resources are overallocated and by how much.
- Find out how many hours each resource is scheduled to work.
- See the percent of capacity at which each resource works.
- Determine how much time a resource has available for additional work.
- Review resource costs.
Practice
1. Use the Commercial Construction project plan created during Lab 8 - Entering Progress. File is opened on the default view Gantt Chart:
Select View → Resource Graph or click the Resource Graph icon on the View bar.
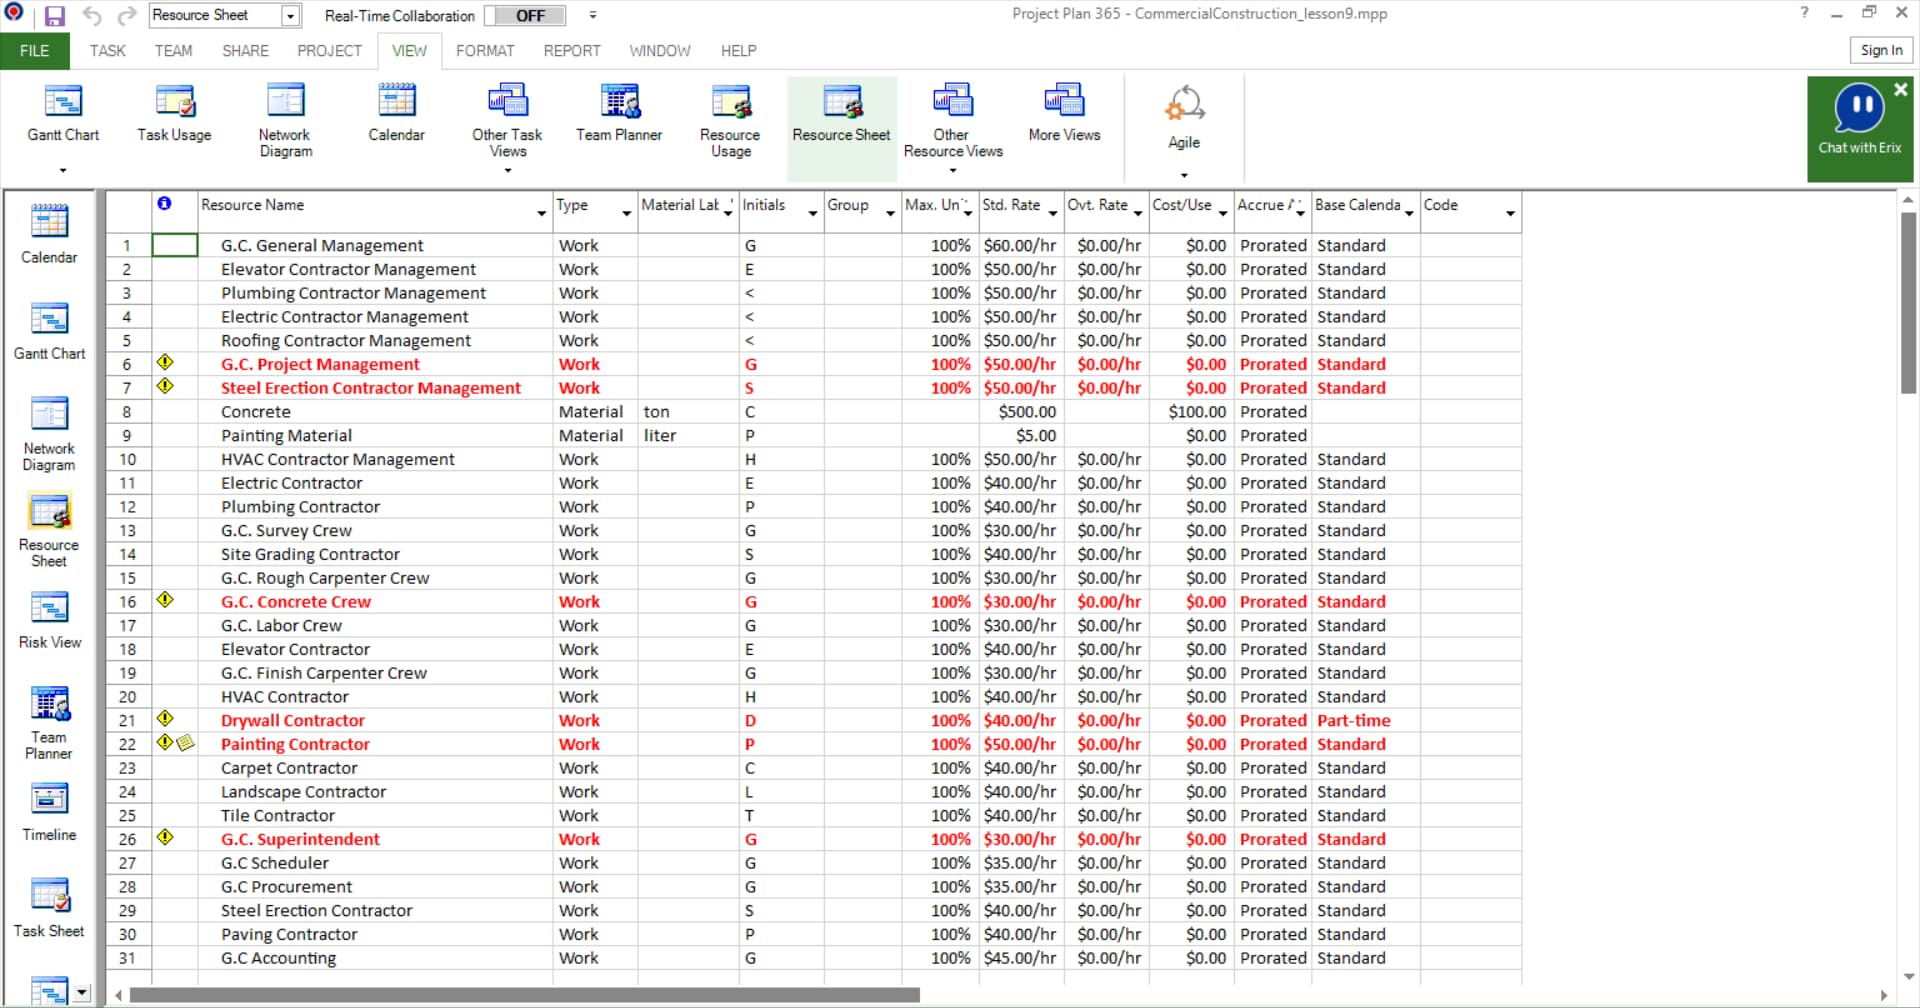
The Resource Sheet displays information about each resource, such as the payment rate, the number of work hours assigned, and the baseline (planned) and actual cost, in a spreadsheet-like format.
You can use a Resource Sheet to:
- Enter and edit resource information.
- Review the number of hours of work assigned to each resource.
- Review resource costs.
Practice
1. Use the Commercial Construction project plan created during Lab 8 - Entering Progress. File is opened on the default view Gantt Chart:
Select View → Resource Sheet or click the Resource Sheet icon on the View bar.
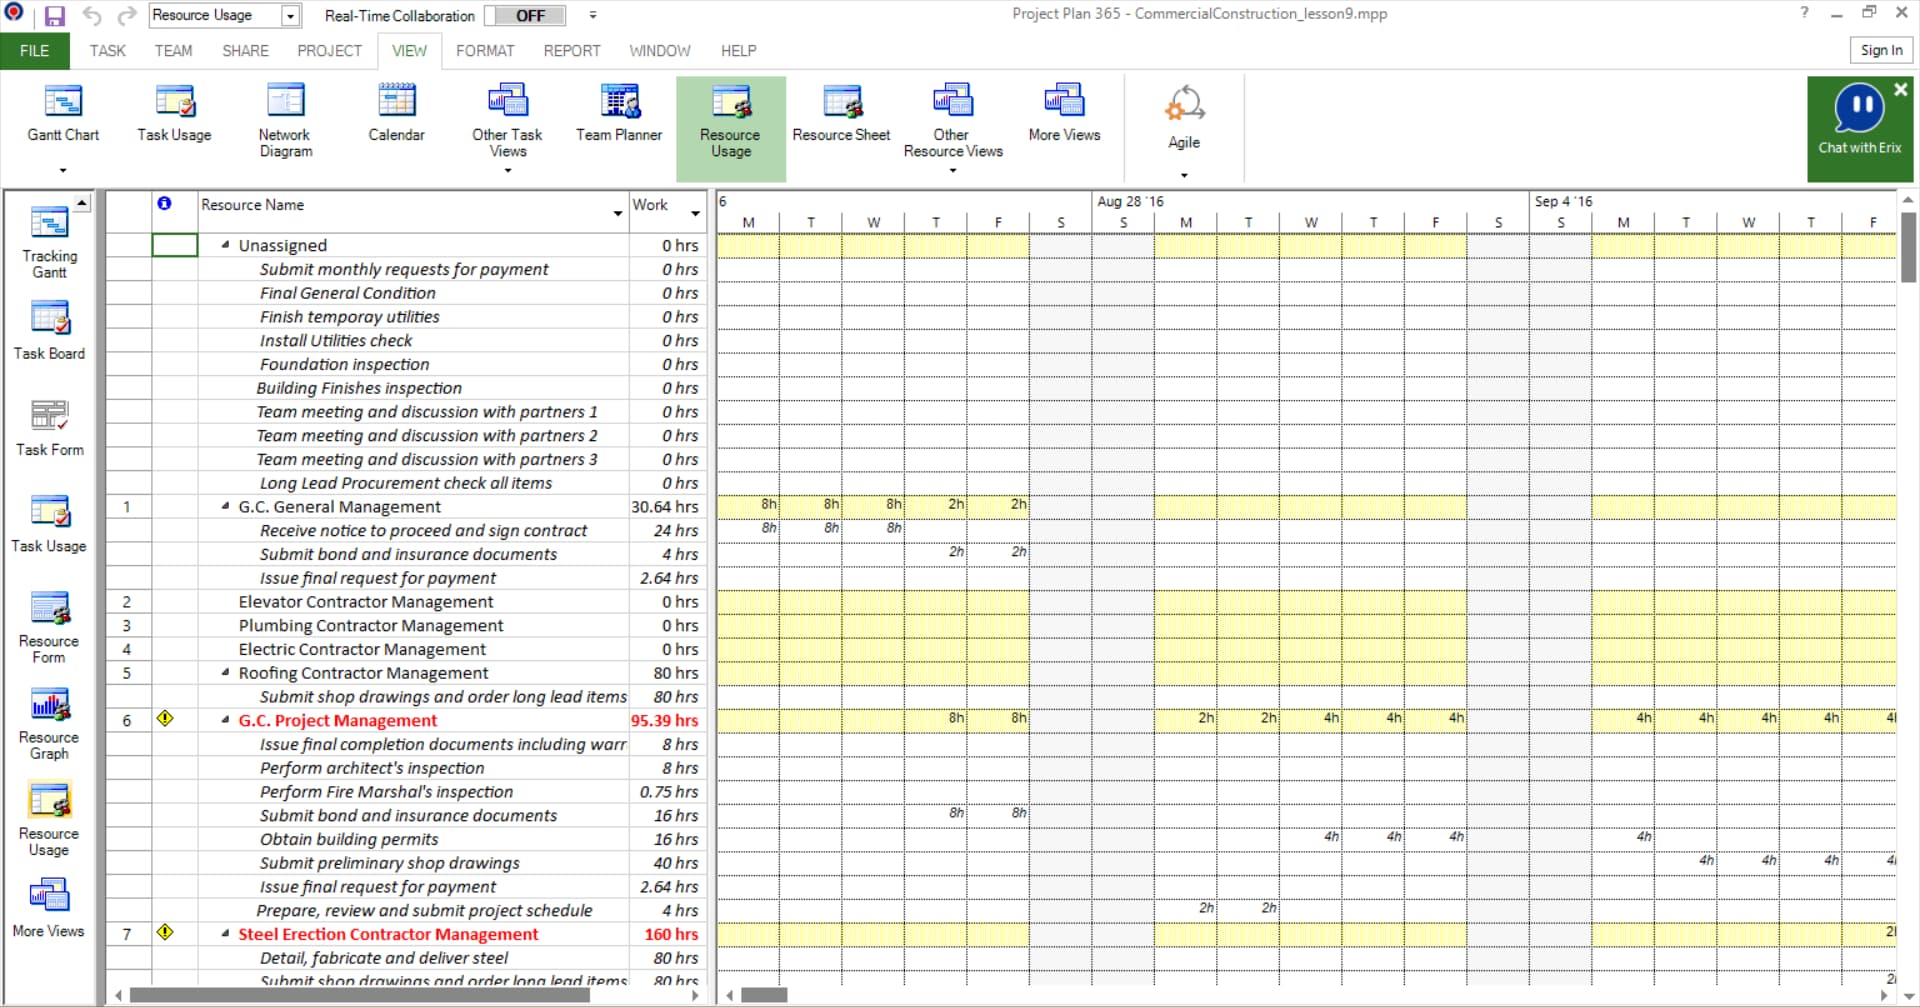
The Resource Usage view displays cost and work allocation information for each resource for a specific time period.
You can use a Resource Usage to:
- View resource information.
- See which resources are overallocated and by how much.
- Find out how many hours each resource is scheduled to work.
- See the percent of capacity at which each resource is scheduled.
- Determine how much time each resource has available for additional work assignments.
- Review resource costs.
Practice
1. Use the Commercial Construction project plan created during Lab 8 - Entering Progress. File is opened on the default view Gantt Chart:
Select View → Resource Usage or click the Resource Usage icon on the View bar.
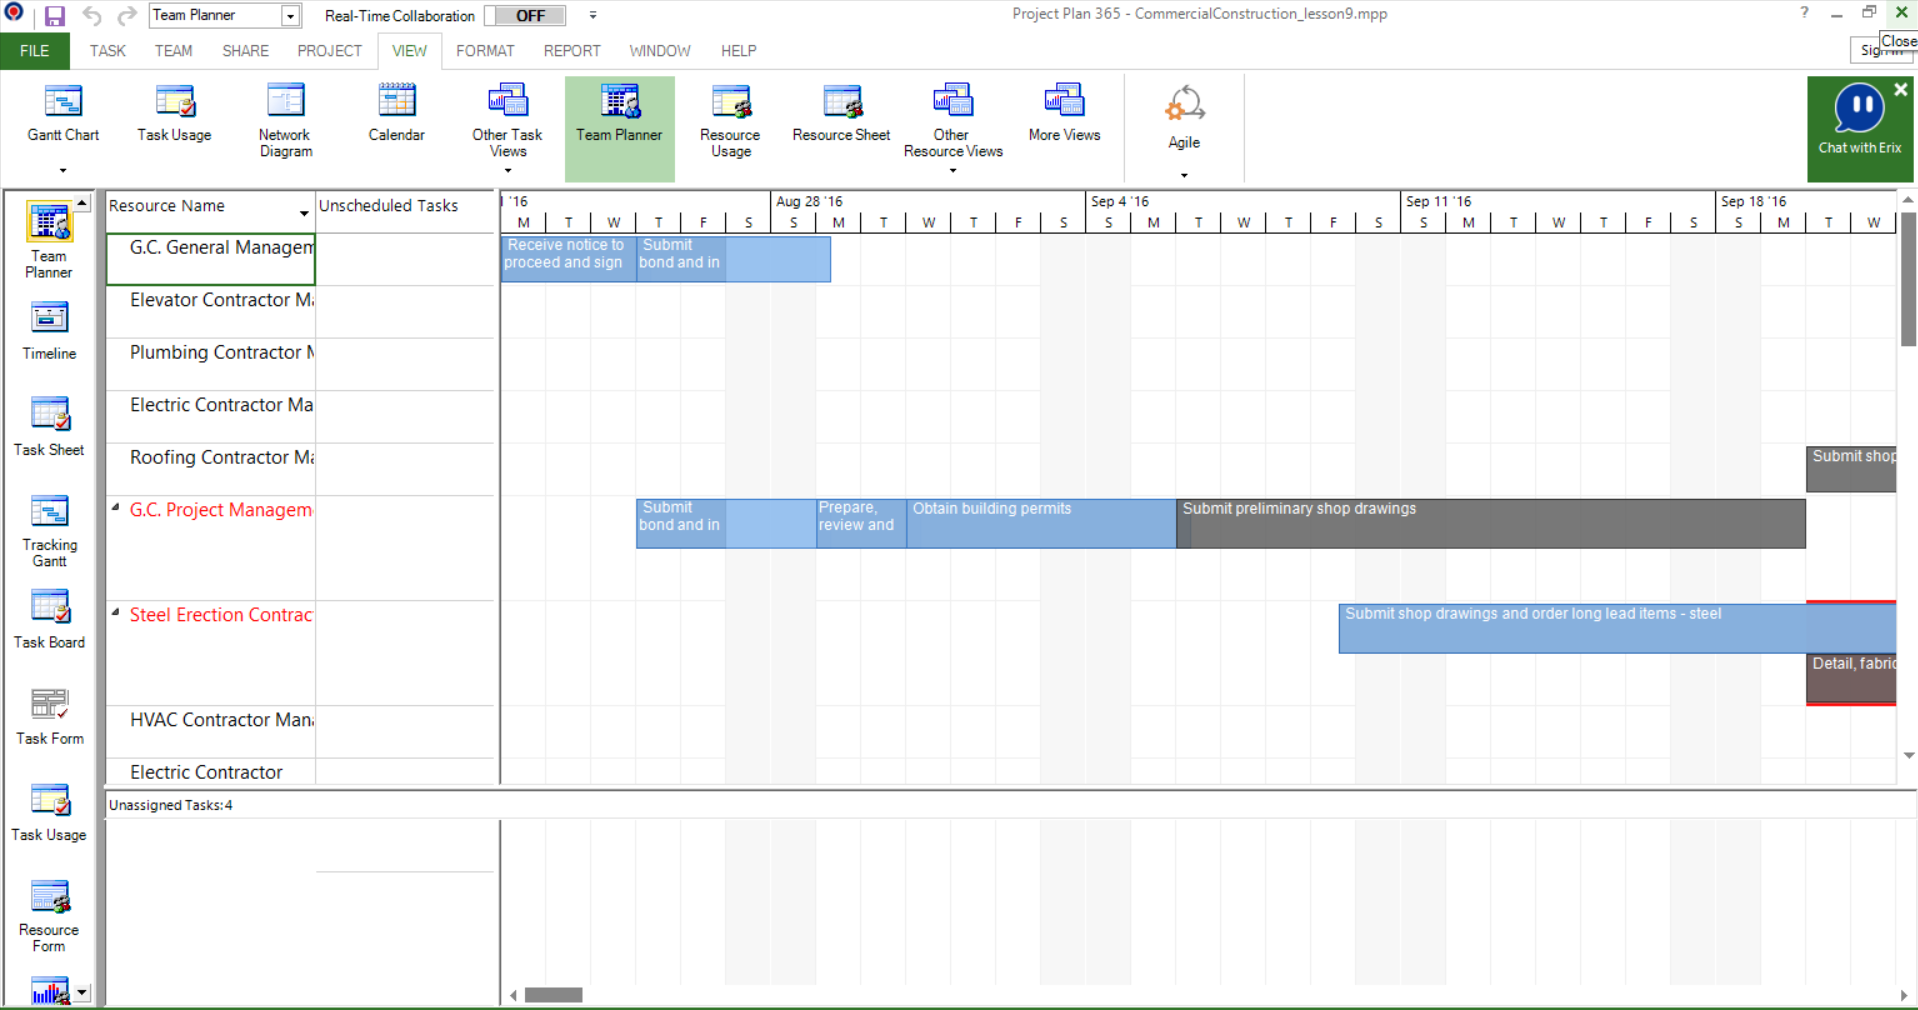
The Team Planner View is great for viewing resource scheduling. With the Team Planner you can easily view what your team members are working on. You can also see unassigned work and over allocations, and see tasks as well as resources - all in one efficient view.
Note: Quick way to get task information: place mouse over the task and most important task information will show in the tooltip.
Practice
1. Use the Commercial Construction project plan created during Lab 8 - Entering Progress. File is opened on the default view Gantt Chart:
Select View → Team Planner or click the Team Planner icon on the View bar.
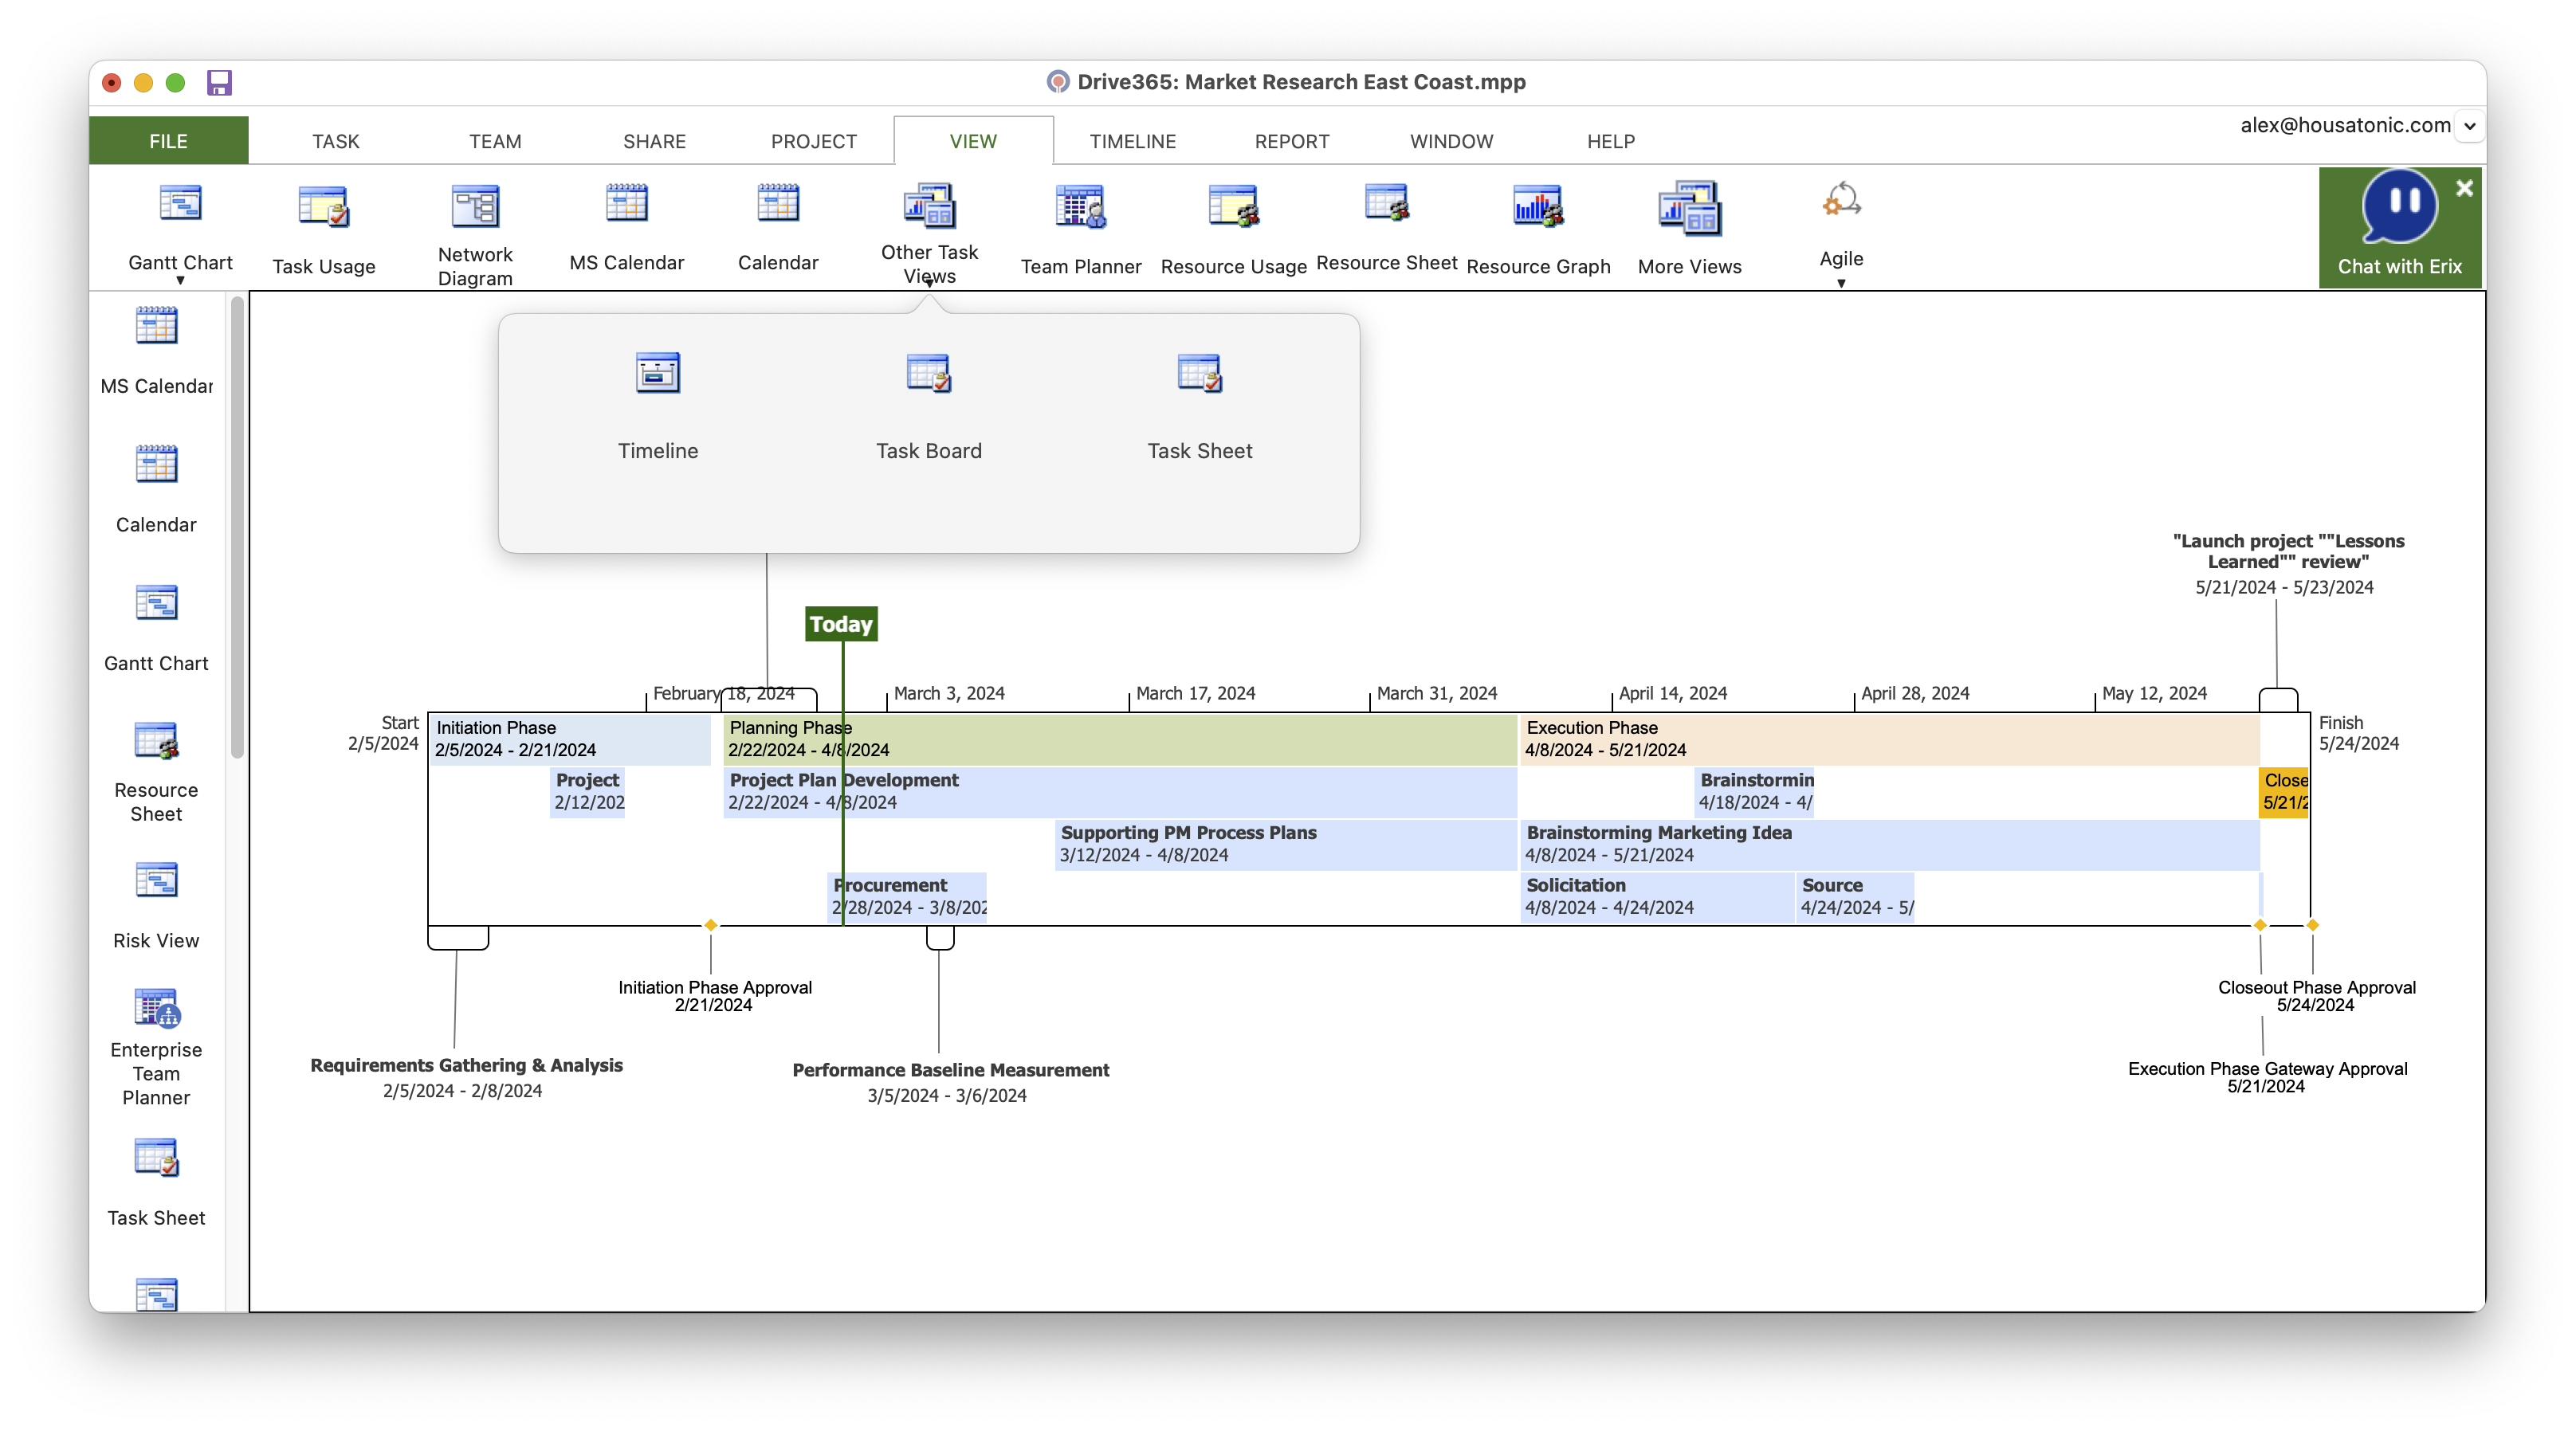
A timeline can really help you out when you need to report "big picture" project information. It's a professional-looking snapshot of key tasks and milestones that's good to go in any status meeting.
 Video
Video
If you prefer to see things in action, rather than reading text, watch out this video, which covers some of the topics from this section.