
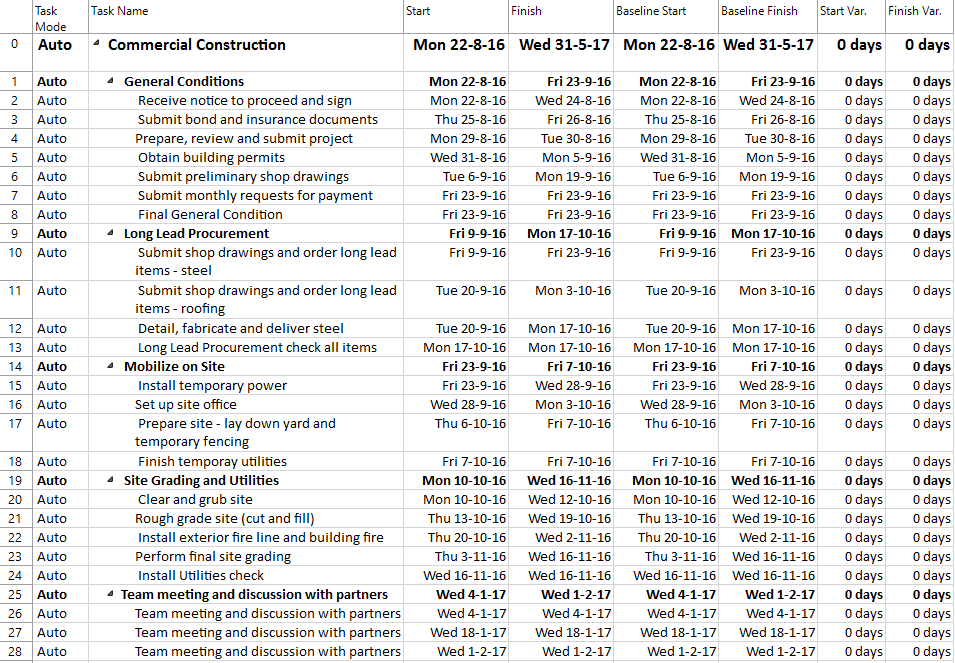
Now that you've created the WBS structure of your project and the planning process is almost finished, you can set a baseline for your project. You can set a baseline after you finished planning your project or you can set one after you finished a critical phase of your project and the baseline will contain information about the tasks, resources and assignments within their phase. The project baseline should always come in-between the planning phase and the start of the project. You should only re-baseline when you have major changes in your project such as: delays, overrun of budget or loss of key resources. The right place in time to do the first baseline is when the initial planning is done and the budget is approved. Set a baseline for your project so that you can track its progress against the original project plan. A baseline is a reference point for the project schedule. An interim plan is a set of current project data that you save after the project begins and that you can compare against the baseline.
A project baseline is an initial snapshot of your schedule when you first save your project information to track progress and compare your updates. Baselines help you visualize and attain your project schedule, work and cost objectives. It is very useful especially in the case of small projects that use agile development, so they need to know in each week which is the difference between the original plan and the current status.
A baseline is a static copy of plan data that's compared with actual and current data. It refers to a set of data about project that represents state before the work actually began. Baselines helps you compare actual vs. planned. Baseline your schedule means taking a copy of your schedule and set aside for comparison later on. It is a snapshot/a picture of your project at a particular moment in time.
A baseline saves nearly 20 pieces of information, including totals information for tasks, resources, and assignments. It will essentially store 5 things: cost, work, duration, start date and finish date. In Project Plan 365, a baseline is a copy of the Start, Finish, Work, and Cost for all the Resources and Assignments, plus Duration for all the tasks in your project. When you do a baseline you save the following data about the project at that specific point in time:
- Tasks: Duration, Start and Finish dates, Work, Cost.
- Resources: Work, Cost, Start and Finish.
- Assignments: Start and Finish dates, Work, Costs.
Together, this data represents the state of your plan at the time the baseline is saved. The baseline will be a valuable tool to use as your project progresses, and after it completes, to compare how the real life of your project matched up with what you projected during the planning stages. Baselines are really important to establish in order to give you a point in time to reflect upon and a area where you can refer back to determine whether or not your assessments are correct, that the durations you've placed in terms of the tasks time are correct and if the costs are correct so that it helps you improve your estimating for future projects.
A baseline is not a separate file. When you save a baseline, Project Plan 365 simply copies the information in scheduled fields to the baseline fields. For example, when you save a baseline, Project Plan 365 copies the information from the Start and Finish fields into the Baseline Start and Baseline Finish fields.
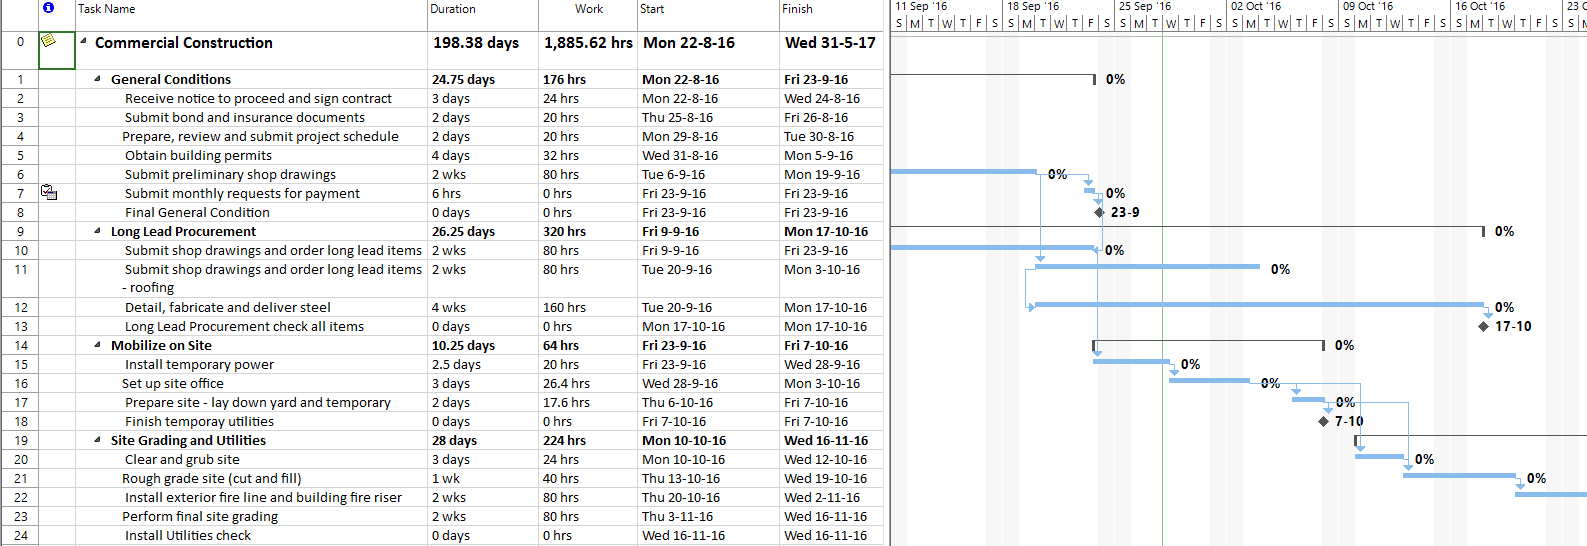
The process of tracking baselines in Project Plan 365 is quite simple. This involves using the Project Statistics dialog, apply Baseline table to Tracking Gantt and add baseline columns in a task view. You can also use the Multiple Baselines Gantt View to track all the set baselines. Initially all the baseline columns are empty until you save a baseline. Once a project's baseline data has been saved, it can be used to analyze project performance. Tracking Gantt is a type of Gantt Chart view, that is designed to compare baseline dates and eventually show all these differences. The Tracking Gantt allows you to view changes to the baseline schedule graphically and to easily compare the project schedule against the initial plan. The variance between the task bars is easy to track. Initially when nothing is updated, the bars are the same, they match each other, but when you start updating your plan, you'll notice slippage if you come behind schedule.
 Practice
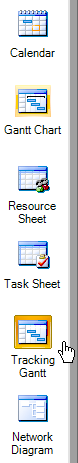
1. Now that the schedule is finished at least in its planning stages, let's create a baseline for the current project. When dealing with baseline, it is recommended to use the Tracking Gantt view. To switch to this view, click on Tracking Gantt from the left View Bar.
2. This view, called Tracking Gantt, is a type of Gantt Chart, that is designed to compare baseline dates and allows you visually see these differences. By using the Tracking Gantt, you can compare progress by comparing baseline and scheduled. In the right side part, next to each taskbar you may notice percent values, which represent the % complete value of each task. So far, it isn't entered any progress for the tasks in the project, and as you might see, you have only 0% values displayed to the right of each taskbar.
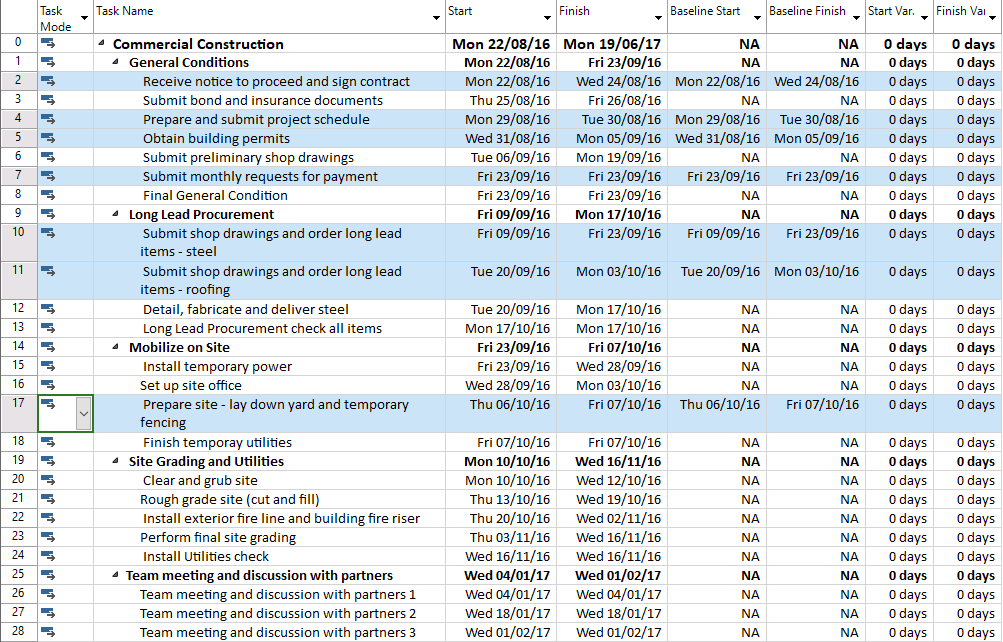
3. In the left side, change the table which is currently applied. From the Project menu, click on Table, then select the Variance table.
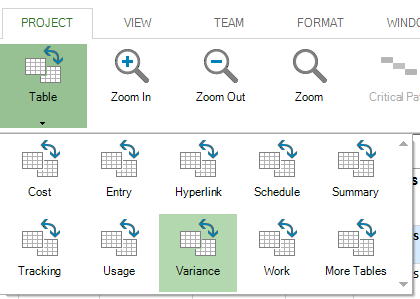
The Variance table shows start and finish dates for both scheduled information and baseline information, making it possible to evaluate your prediction of how the project would progress (baseline) by comparing that prediction with how the project is in fact progressing (actual). You may need to resize some columns to reveal more content of them.
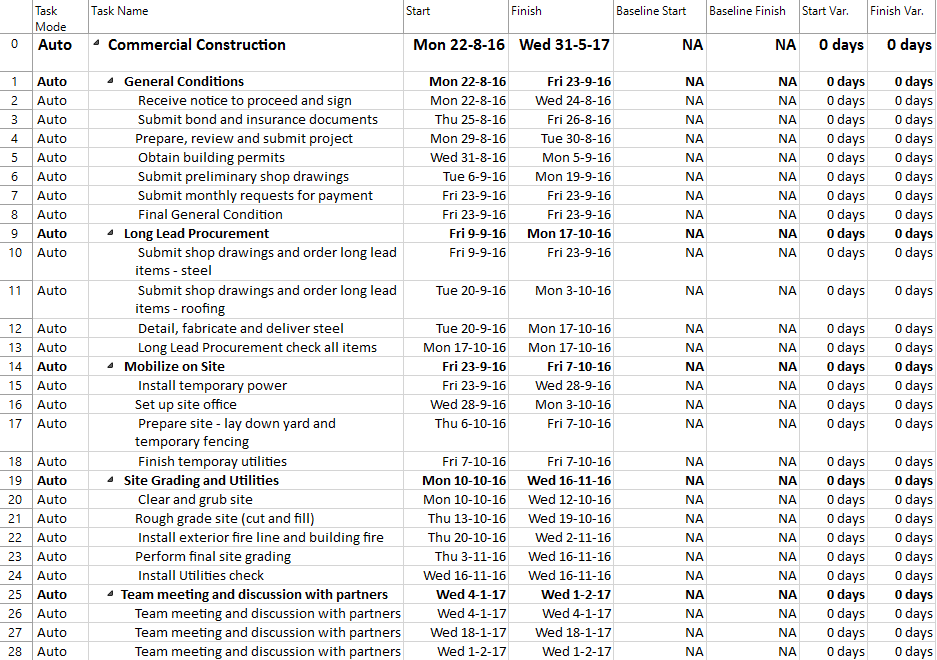
As you may notice, since it isn't set yet any baseline for the schedule, in the Baseline Start and Baseline Finish columns there is nothing filled yet. You see displayed NA, meaning Not Applicable. Let’s see what happens when you set a baseline.
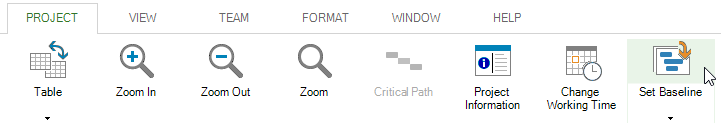
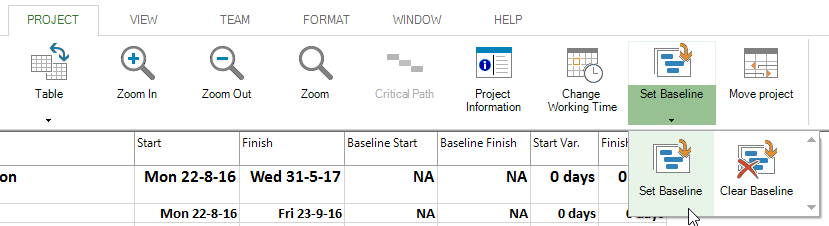
4. Now, let’s create a baseline for the current project. To set a baseline in your schedule, head to the Project menu and simply press on Set Baseline option, or alternatively press on the arrow below the Set Baseline option and then choose Set Baseline from the drop-down list.
5. Notice that the Set Baseline dialog appears that allows you to either set a Baseline or Interim plan and to either set the Baseline for the Entire Project or for Selected Tasks.
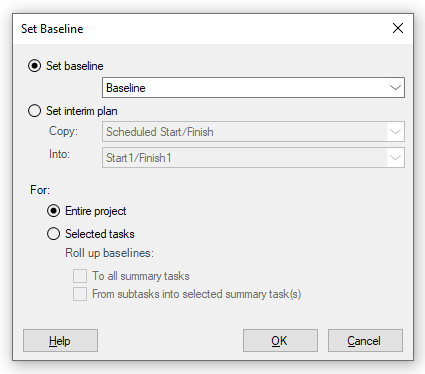
6. In the Set Baseline dialog, select the Set baseline option and the Entire Project option to set the Baseline for the whole project and click OK.
7. You can also set the Baseline only for selected tasks. To do so, select the tasks you want then go to the Project menu and simply press on Set Baseline option. In the Set Baseline dialog select Selected tasks and click the OK button.
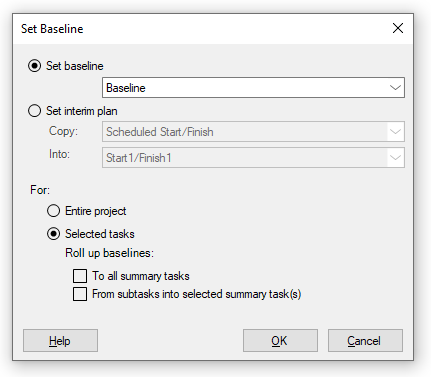
Notice that in the left side table, only for the selected tasks the two columns will get populated with values.
But for now, let’s leave the Baseline set for the Entire Project.
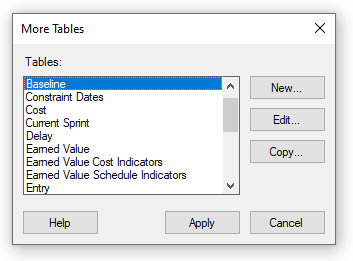
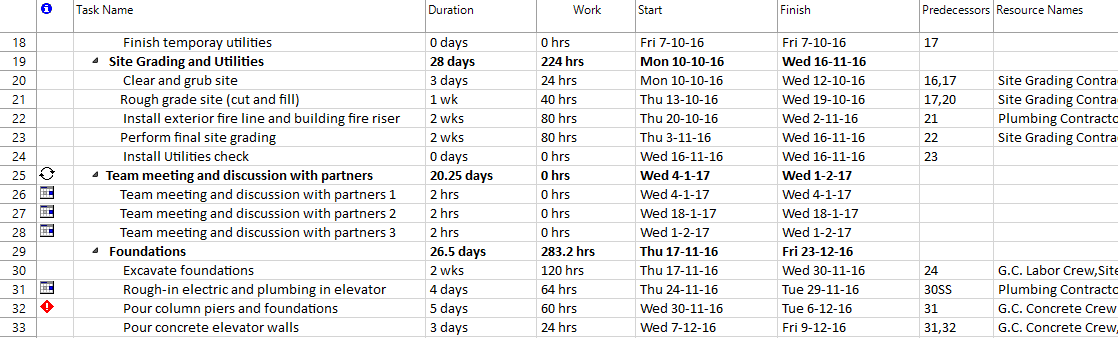
8. Similar information will be displayed if you change the table in the left to Baseline, which helps you to view the baseline data of the project that was just saved. Click on Table option under Project menu, then select More Tables. From the opened dialog select Baseline.
A baseline is a copy of the Start, Finish, Work, and Cost for all the Resources and Assignments, plus Duration for all the Tasks in your project.
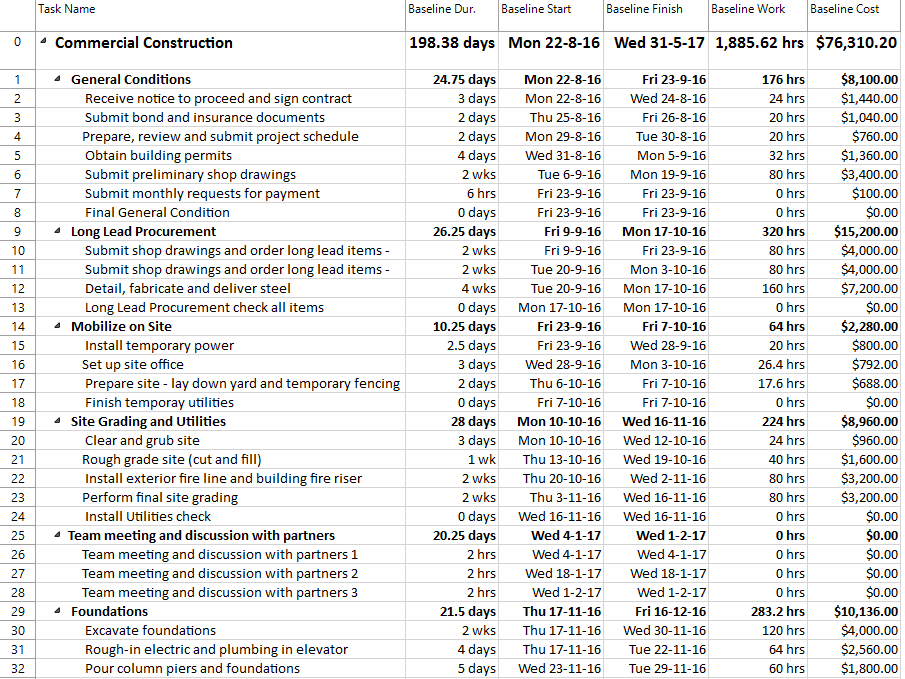
9. Insert in this left table the Duration column by right-clicking on Baseline Start column and choosing Insert Column from the contextual menu. In the Column Definition dialog choose the Duration field.
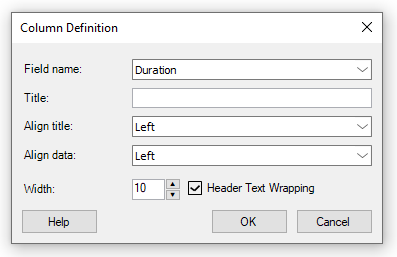
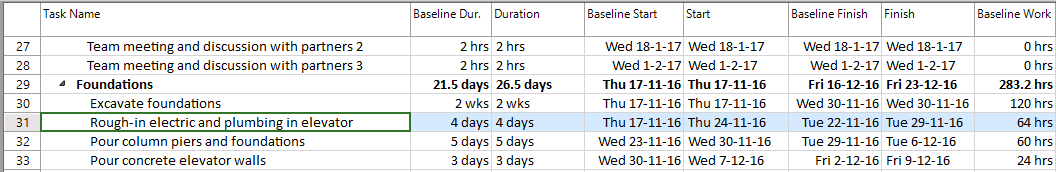
Notice that currently, for instance, the values in the Baseline Duration column are an exact copy of the values from the Duration column.
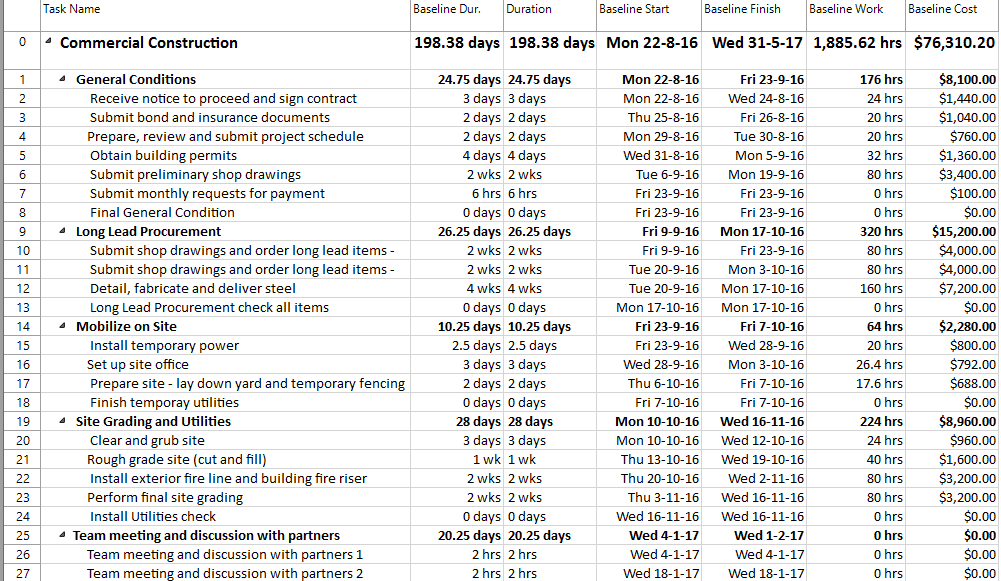
10. In the right side of Tracking Gantt view, you may notice some grey bars that come underneath. These are the Baseline bars. Now, the Tracking Gantt view displays two task bars, one on top of the other, for each task. The lower bar shows baseline start and finish dates, and the upper bar shows scheduled start and finish dates. Once the baseline is set, any changes in the plan that is different from the baseline will become obvious and immediate, helping you to perform an analysis of the schedule. Now, initially when nothing is updated, the bars are the same, they match each other, but when you start updating your plan, you'll notice slippage if you come behind schedule.
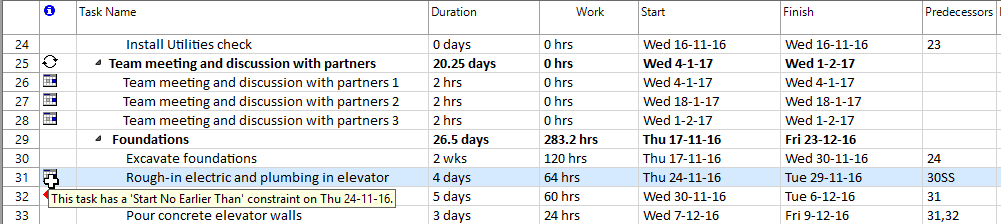
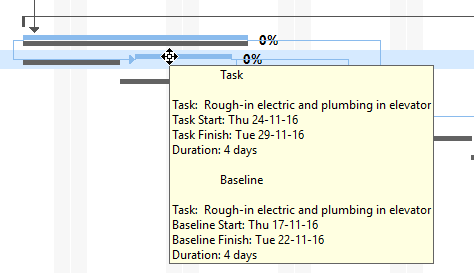
11. If for instance, we have a week delay for some of our tasks, we can visually see in the Tracking Gantt the impact of this. For example if a task starts later than what’s planned, it is behind schedule. Let’s assume that "Rough-in electric and plumbing in elevator" task starts later with 1 week than what was planned. For this, let’s change the start date of this task in a visually manner by using the right chart in this view. First locate the bar corresponding to this task in the right side. To change the start date of the task, drag the task bar to the right till it reaches the new start date. During the dragging process, a virtual taskbar will be shown, guiding you through the change step. Dragging the taskbar to the right will cause your task to start later. After this, notice in the right chart how will look the two bars, for each task.
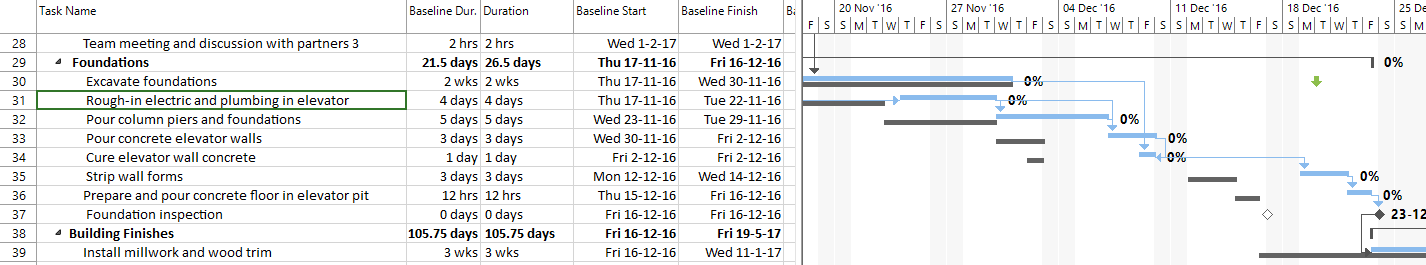
If you change the table in the left to the Entry table, which is the default one in this view, notice that by changing the start date, a Start No Earlier Than constraint is added to the "Rough-in electric and plumbing in elevator" task. This is visually marked in the Indicators column.
When hovering over the icon shown in the Indicators column, the tooltip will say that the task has set a constraint, specifying the type and the date of the constraint.
12. Now let’s come back to the Baseline table in the left side of the view. Here we will also insert Start and Finish columns. Right-click on Baseline Finish column and select Insert Column from the contextual menu. In the Column Definition dialog select Start field. Proceed in the same way and right-click on Baseline Work column. Select Finish in the Column Definition dialog. In this way, the Start column will be inserted after Baseline Start column, and the Finish column will be placed after the Baseline Finish columns, to allow for an easier comparison. For the "Rough-in electric and plumbing in elevator" task if we look closer in the Baseline Start and Start columns we notice that their values do not match like before. A similar situation is for Baseline Finish and Finish columns.
This fact is also confirmed if in the right side panel we hover over the bar for this task and look at the information displayed in the tooltip.
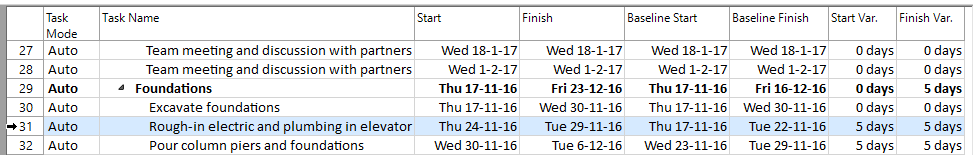
Besides that, if you change the current table to the Variance one, you may see for this task a value of 5 days for the Start Variance and Finish Variance columns.
13. Now let’s come back to the Baseline table. Notice that the columns that you’ve previously inserted are kept. Next, let’s suppose that the "Perform architect's inspection" task was planned to take 5 hrs, but in reality it took 2 days. So, for this task, in the Duration column type 2 d, meaning 2 days.
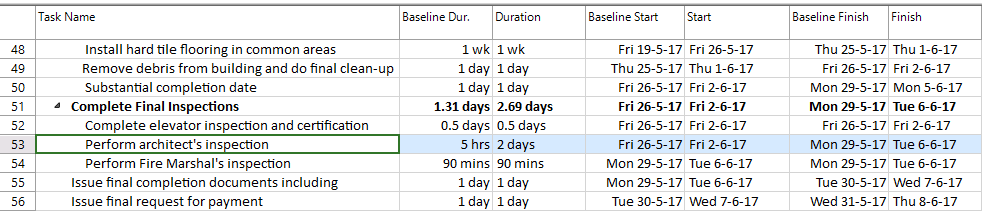
Like previously, since you’ve set a baseline, you can compare it with the scheduled and actual data to see how the project is tracking against your initial goals. Let’s notice what happens in the right chart. The red bar at the top changes and increases its size to 2 days duration. But the grey bar beneath is still consistent and remains to indicate a duration of 5 hrs. Also due to the dependency between tasks the following tasks are rescheduled, causing differences with the dates saved in the baseline, as you might also see in the right chart.
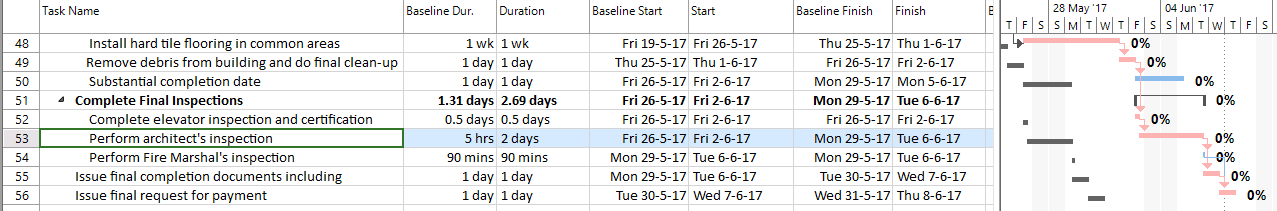
14. Let’s see also what happens with the dates in the left side table. Insert other two columns, namely Work and Cost to assess the current state of the schedule in terms of work and cost. Drag the vertical divider between the two panels to the right to create more space for the left table. Select the Baseline Cost column, right-click on it, select Insert Column and in the Column Definition dialog choose Work. Then repeat the process again for the Cost column. Move the Cost column after Baseline Cost by dragging it to the right. If you look in this table at the "Perform architect's inspection" task, you may notice the differences between the Baseline Duration and Duration values, and Baseline Finish and Finish values. Also the change in the current task duration draws some changes in the current values for Work and Cost, being different from their counterpart values stored in the baseline.
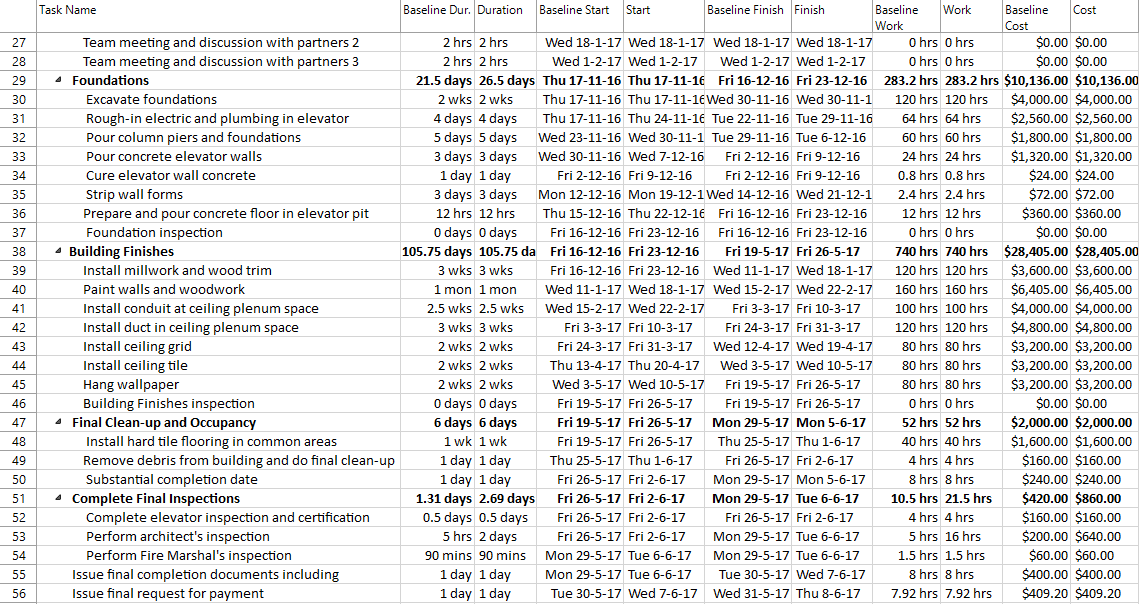
15. Now, that you've set a baseline for your project, you can compare the actual dates to the original planned dates, that were captured in the baseline. In this way, you can use the baseline as a basis of comparison as you track progress of the project. So, let’s go at the first row corresponding to the project summary task and look at the value for the finish date. You see that now, according to the recently adjustments that you’ve made, the project finishes on 8 of June, which is different from the date of 31 May the project was planned to finish on, as you see in the Baseline Finish column. So you have a delay of a few days, compared to the initial schedule.

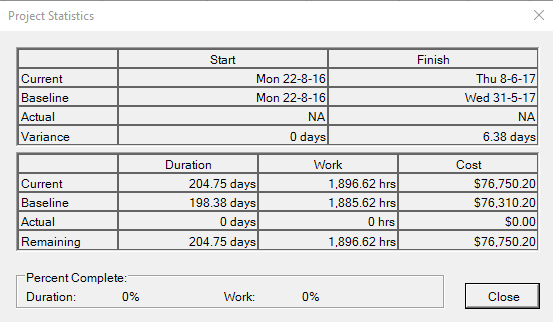
16. Another place where you can see the impact of baseline is in the Statistics dialog. To have a look on it, in the Project menu, press on Project Information, then on Statistics, where you can see a baseline entry for Start, Finish, Duration, Work and Cost columns. You can also notice in the Finish column a variance of 6.38 days for the project finish date, reflecting the fact that now the project ends later with 6.38 days compared to what was originally planned. Notice also the differences between the Current Work and Baseline Work values, as well as for the Cost.
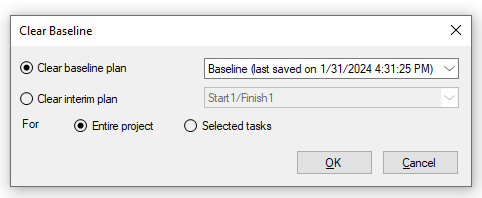
17. If you want to remove the baseline set in your project, go to the Project menu, press on the arrow down to the Set Baseline option and in the displayed list you will see Clear Baseline.
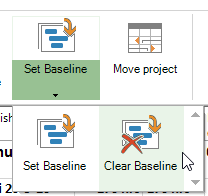
Here you also have the possibility to either remove a Baseline or an interim plan for the entire project or only for selected tasks. In the Clear Baseline dialog select “Baseline” field from the Clear baseline field and check the Entire project option then click the OK button.
 Video
Video
If you prefer to see things in action, rather than reading text, watch out this video, which covers some of the topics from this section.