
A baseline is generically known as a value or condition against which future measurements can be compared. Within the context of project management, these values and conditions are the project’s scope, cost and schedule. A project baseline can be thought of as a “snapshot” of a project’s initial condition, just before work begins.
Baselines are used to evaluate project performance over time, by comparing an initial project snapshot with any subsequent images captured while your project progresses. Baselines are also used to quantify any variances from the original plan while the plan is in motion.
You can also think of a project baseline as a “sanity check,” in the sense that project sanity is defined as not making the same mistake over and over again while hoping for a better result!
Once your project is designed, capturing an initial project baseline is the first step taken to ensure better project performance — and PM sanity – over time. The baseline draws a line in the sand that says, “This is what we thought was going to happen, vs. what actually happened.”
Most decent project management tools have a feature for capturing the initial baseline and displaying any variances from that initial line in the sand. Project Plan 365 & Microsoft Project are no exception. Both can store and display up to 10 baselines for any given project (or for a select group of tasks). The typical baseline metrics most project managers use are: baseline duration, work and cost. However, many other metrics can be defined and then displayed.
When setting up a project plan, it is important to remember to set the initial baseline before putting the schedule into play. In other words, this step needs to be taken before work begins, but after you have designed your project plan and when you are ready to roll.
Note: Forgetting to set an initial baseline is a common mistake, and this boo-boo can’t easily be rectified once your plan is in motion.
>>> To work along with the following tutorial, download this sample plan (and Project Plan 365, if you don't have already) <<<
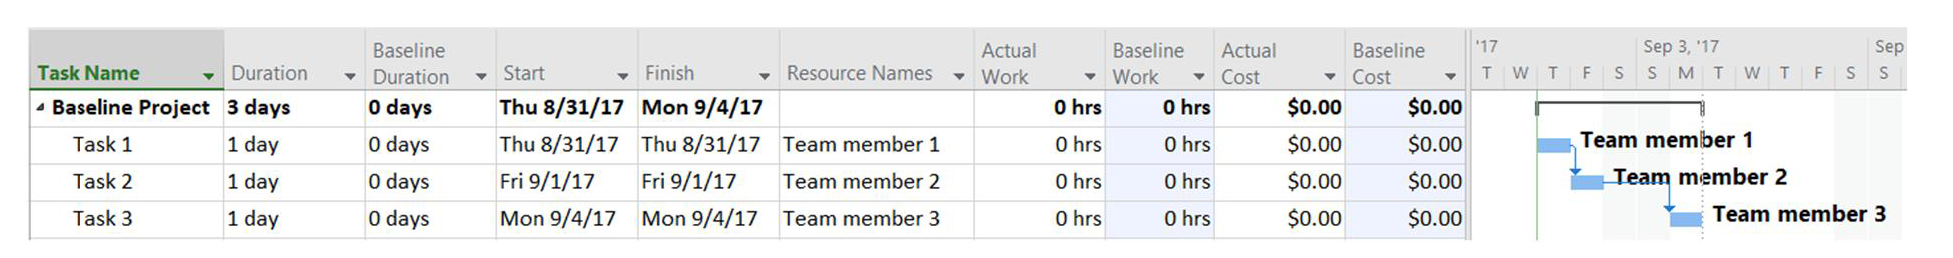
To visualize how a baseline is used, let’s take this simple three-day, three-task, three-person project as an example, before the initial baseline has been set:
Step 1. Open a plan in Gantt Chart view for a project with no baseline set:

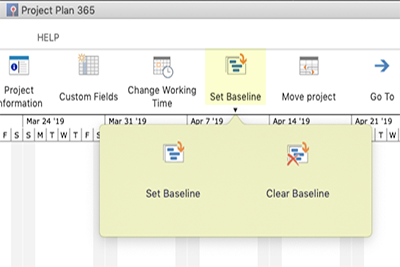
Step 2. Navigate to the Project ribbon / Set Baseline and set the baseline there:
Once you have set an initial baseline, the app begins crunching numbers and updating baseline values in fields and on the Tracking Gantt chart, as each change is made:

Step 3. Now with a baseline set, you can begin tracking and then see the changes made to your plan. Let’s assume that our three-day, three-task, three-person project was completed, but with Team member 1 — being the slowpoke that he is — is taking two days to complete the one-day task as planned. The resulting display in our project plan now shows this variance, using actual values and baseline values - and displaying a baseline “shift” in the Tracking Gantt chart:

Variances (baseline shift) are shown in baseline fields and on the Tracking Gantt chart. Baseline shifts are an important indicator of project performance over time and should be employed by every project manager when evaluating project metrics.
A quick way of seeing these shifts in your plan, is to use the Project ribbon to view Project Information / Project Statistics, which are updated in real-time. Project Statistics shows basic baseline values and variances from the actuals: